


Support and Resistance Indicator V1.0
Total Sold: 1
Original price was: $512.00.$0.00Current price is: $0.00.
In stock
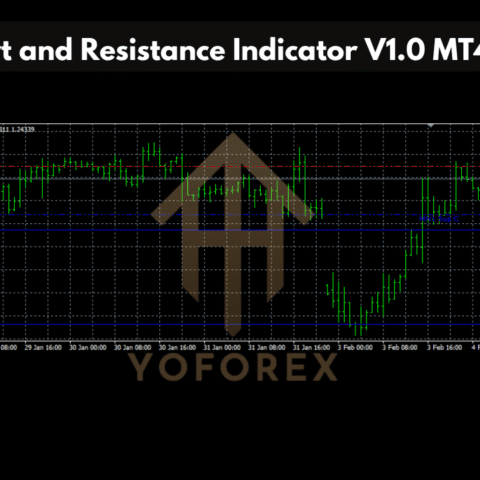
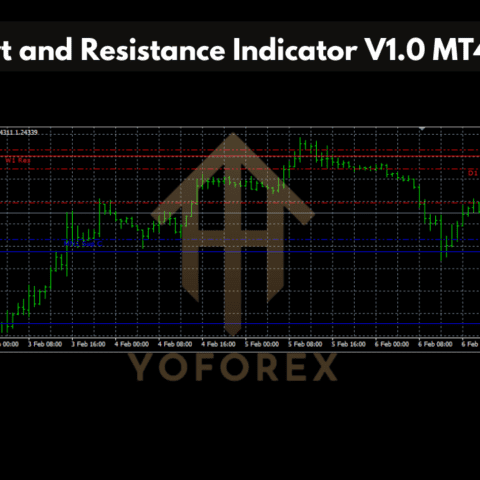
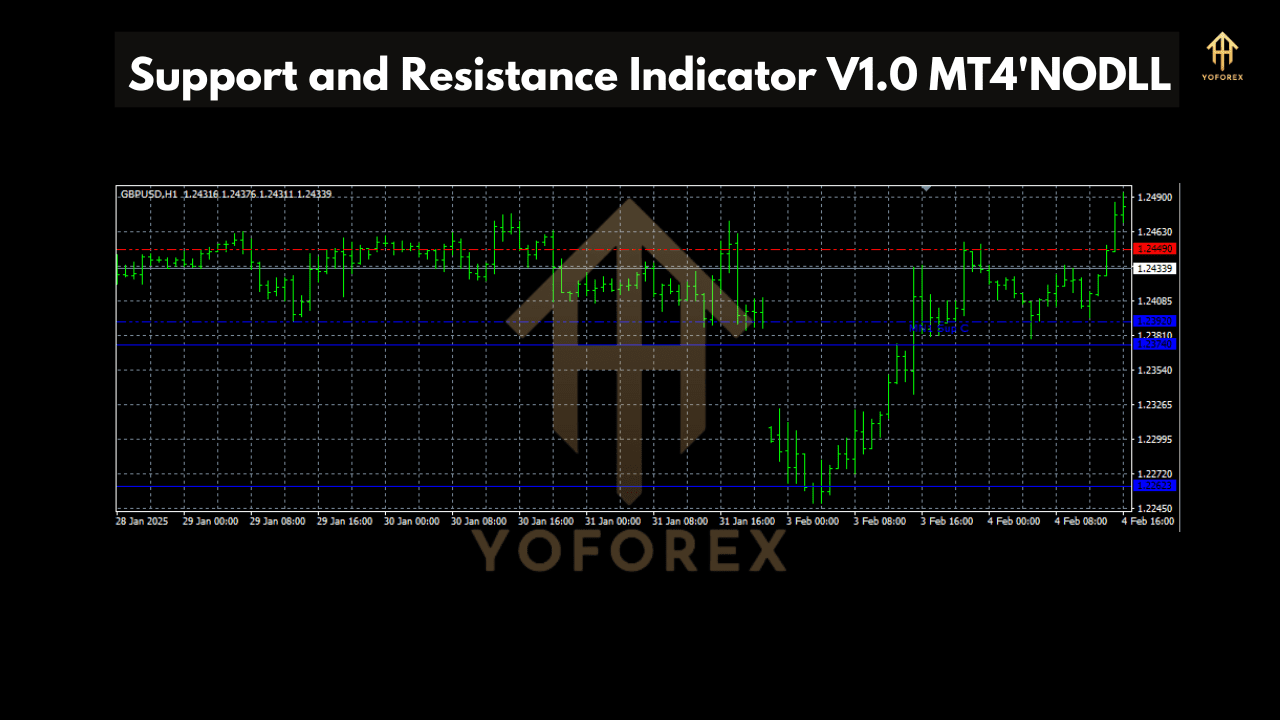
The Support and Resistance Indicator V1.0 for MT4 helps traders identify key price levels where the market is likely to reverse or consolidate. It automatically plots support and resistance zones, improving trading decisions. Ideal for beginners and experts, it works on all timeframes and currency pairs. Enhance your technical analysis with this powerful tool to spot breakout opportunities and trend reversals effectively.
Support and Resistance Indicator V1.0 MT4 – The Ultimate Trading Tool
The Support and Resistance Indicator V1.0 for MT4 is a powerful tool designed to identify crucial price levels where the market is likely to react. By utilizing this indicator, traders can improve their accuracy in determining entry and exit points, reducing risk and increasing profitability.
If you’re looking for a robust strategy to trade efficiently, this indicator is a must-have in your arsenal. With clear support and resistance levels, traders can identify potential reversals and breakouts, helping them make informed trading decisions.
 Key Features:
- Auto-detects Support & Resistance levels
- Works on all major forex pairs
- Provides entry & exit signals
- Works on multiple timeframes
- Simple & easy to use
Trading Strategy Overview
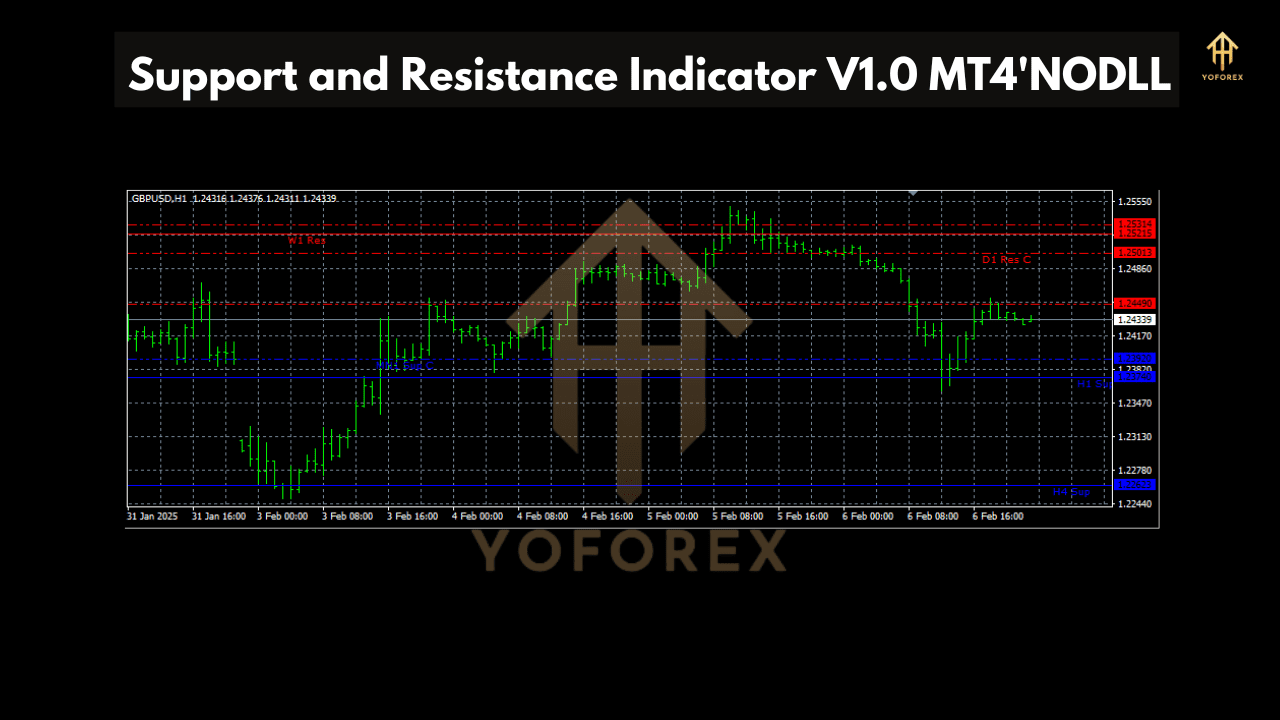
The Support and Resistance Indicator V1.0 MT4 identifies high-probability trading zones where price reactions are likely. It works on the principle that past price levels act as barriers where buyers and sellers compete, leading to potential trade opportunities.
 How the EA Executes Trades
The trading algorithm follows these key principles:
- Identifying Key Zones: The EA automatically plots strong support and resistance levels on the chart.
- Waiting for Confirmation: When the price reaches a key level, the EA waits for confirmation signals such as candlestick patterns, volume spikes, or momentum shifts.
- Entry Triggers:
- Buy Trade: If the price touches a support level and shows bullish confirmation (e.g., pin bar, engulfing candle, or RSI divergence), the EA places a buy order.
- Sell Trade: If the price reaches a resistance level and shows bearish confirmation, the EA places a sell order.
- Stop Loss & Take Profit:
- Stop loss is placed below support for buy trades and above resistance for sell trades.
- Take profit is set at the next key level or based on a risk-reward ratio (typically 1:2 or 1:3).
- Trade Management:
- The EA includes trailing stop-loss to lock in profits as the price moves in favor of the trade.
- It avoids false breakouts by using multiple timeframe confirmation.
Trading Specifications
| Parameter | Details |
|---|---|
| Minimum Deposit | $200 |
| Timeframe | Works best on M15, H1 |
| Currency Pairs | EUR/USD, GBP/USD, USD/JPY |
| Risk Management | Stop-loss & trailing stop |
| Trading Style | Swing & intraday trading |
 Why Use the Support and Resistance Indicator V1.0 MT4?
- Precision Trading: Identifies strong price levels where the market is likely to react.
- Better Risk Management: Helps traders set clear stop-loss and take-profit levels.
- Works with Multiple Strategies: Can be combined with other indicators like RSI, MACD, or Moving Averages.
- Avoids False Breakouts: Uses advanced filters to confirm breakout trades.
Ideal Trading Conditions
| Scenario | Action to Take |
| Price near support + bullish signal | Open a buy trade |
| Price near resistance + bearish signal | Open a sell trade |
| Strong breakout of support or resistance | Wait for a retest before entering |
| Weak breakout with no confirmation | Avoid the trade |
 Example Trade Setup
- Buy Setup:
- Price approaches 1.1000 (Support Level) on EUR/USD.
- Bullish engulfing candle appears.
- Entry: Buy trade executed.
- Stop-loss: Placed below support at 1.0980.
- Take Profit: At next resistance level 1.1050.
- Outcome: Trade closes in profit.
- Sell Setup:
- Price reaches 1.2000 (Resistance Level) on GBP/USD.
- RSI shows overbought condition.
- Entry: Sell trade executed.
- Stop-loss: Placed above resistance at 1.2025.
- Take Profit: At next support level 1.1950.
- Outcome: Trade hits take profit.
 Download Now
Ready to enhance your trading experience with the Support and Resistance Indicator V1.0 MT4?  Download now from our website: https://www.yoforex.org/
Conclusion
The Support and Resistance Indicator V1.0 MT4 is a powerful tool for traders looking to improve their entry and exit accuracy. With a minimum deposit of $200, traders can leverage this indicator for smart trading decisions, reducing risk and maximizing profits.
Join our Telegram for the latest updates and support: https://t.me/yoforexrobot
Please Join: https://t.me/+M-kFQePDgy5lZjY1
Stay Updated:
Instant Download: https://yoforexea.com/product/support-and-resistance-indicator-v1-0/
https://www.fxcracked.org/product/support-and-resistance-indc-v1-0/
https://www.mql5.software/product/support-and-resistance-indicator-v1-0/
 Happy Trading
Related products

-100%

-95%

-44%

-93%
-95%
-93%

-46%

-100%

-83%
-100%
-95%
-44%
-93%
-95%
-93%
-46%
-100%
There are no reviews yet.