
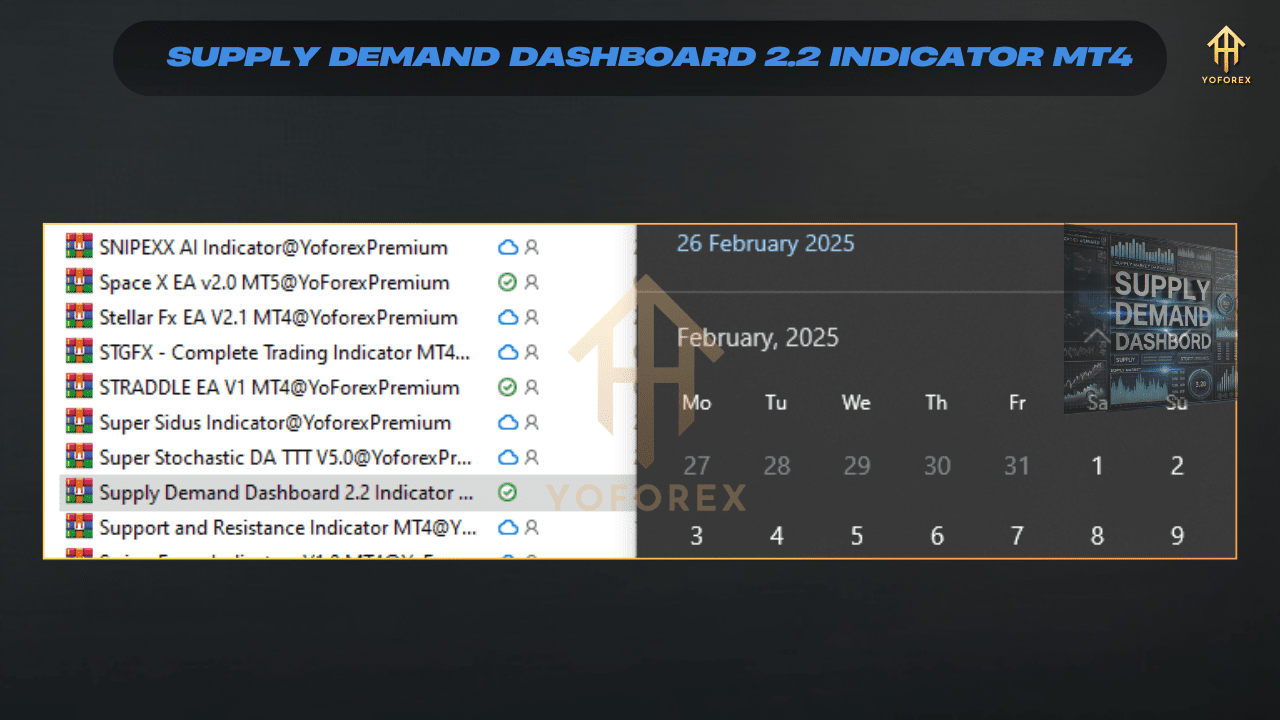

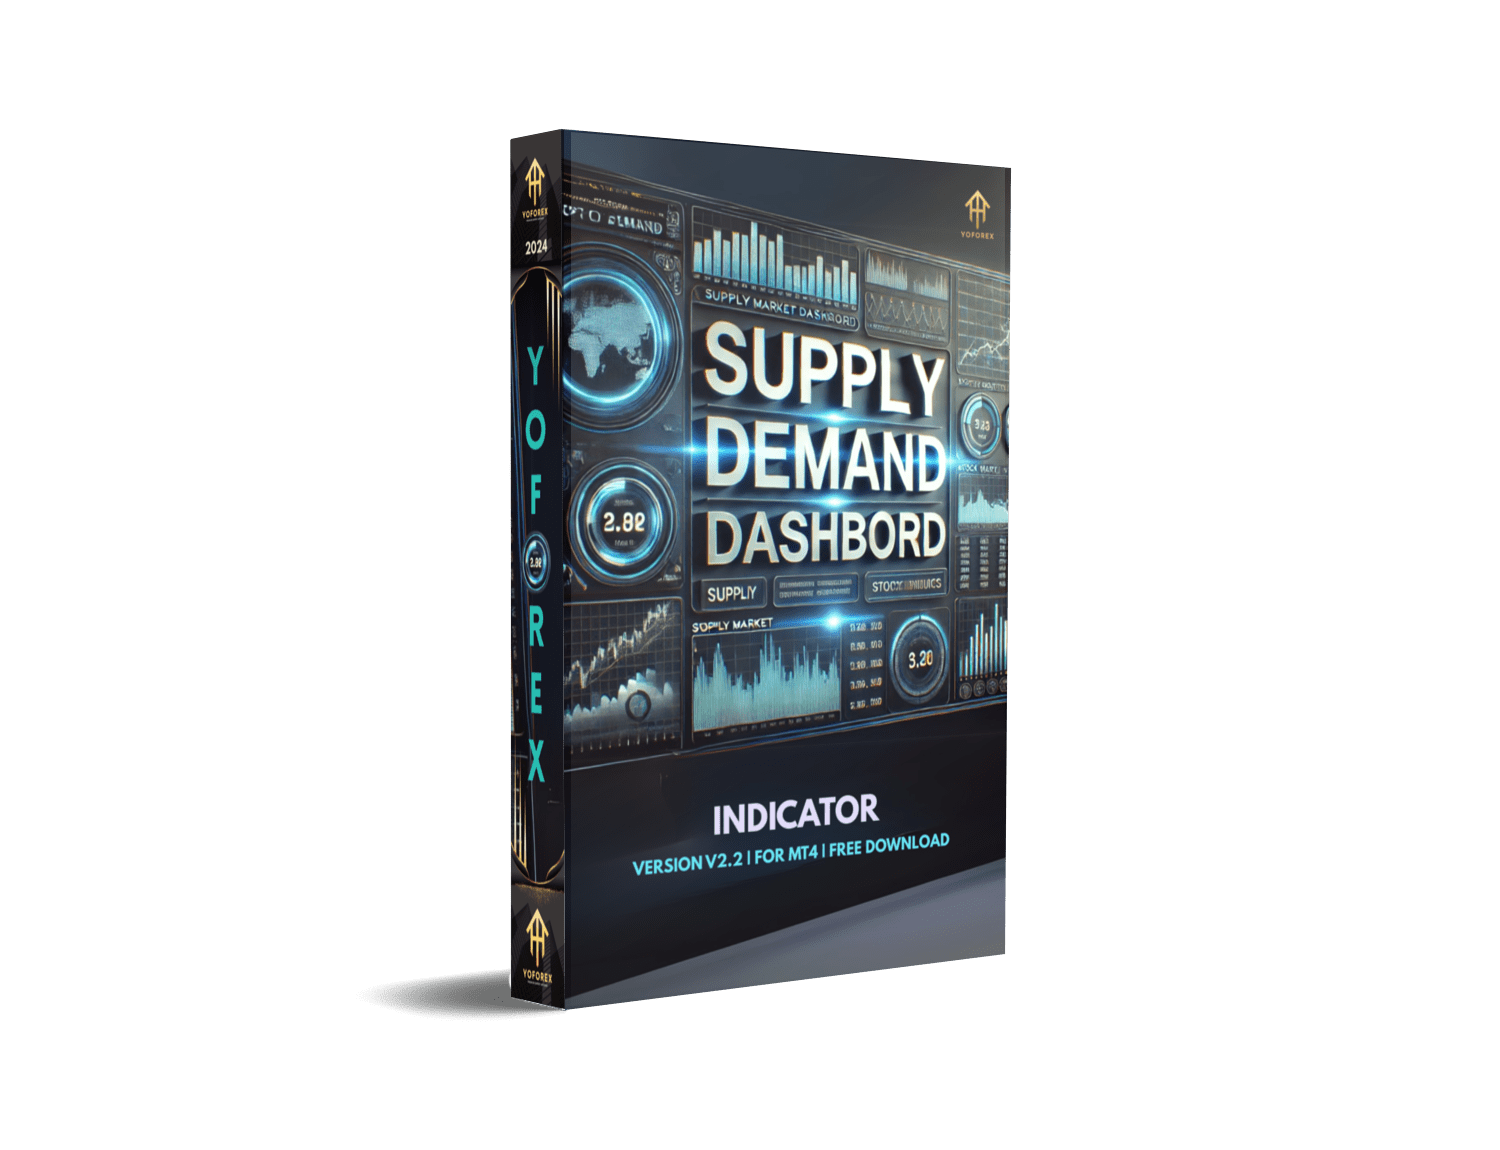
Supply Demand Dashboard V2.2 Indicator MT4 – The Ultimate Trading Tool
The Supply Demand Dashboard V2.2 Indicator MT4 is a powerful trading tool designed for forex traders who rely on supply and demand strategies. This indicator provides a comprehensive view of market imbalances, helping traders identify high-probability trading opportunities. Whether you are a beginner or an experienced trader, this tool simplifies the process of spotting key supply and demand zones across multiple timeframes, making trading decisions easier and more effective.
What is the Supply Demand Dashboard V2.2 Indicator?
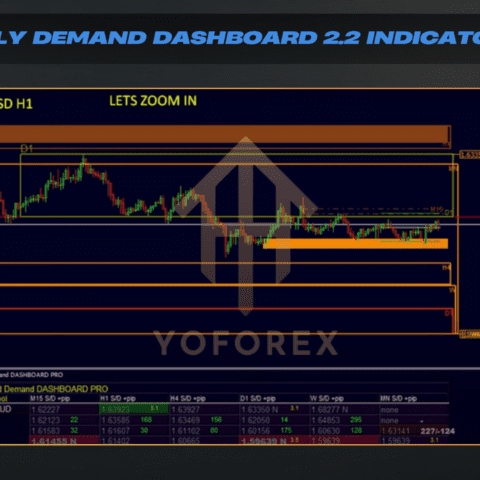
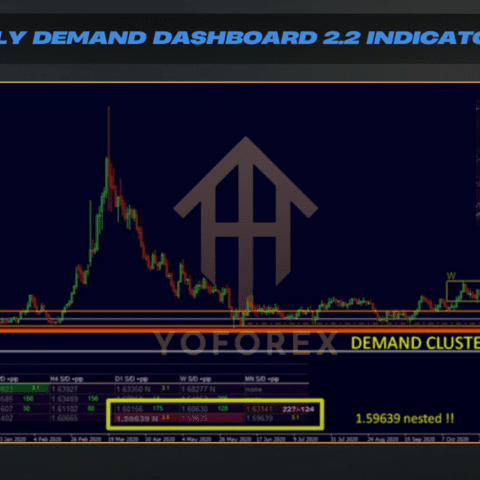
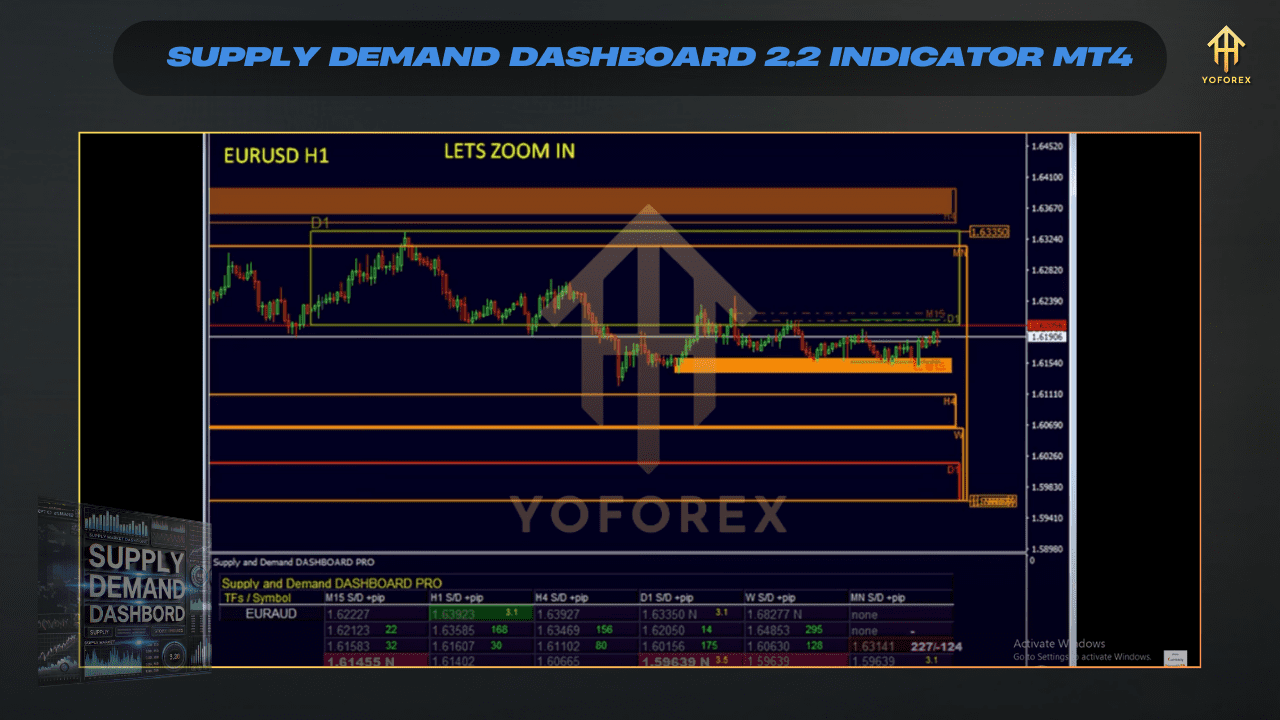
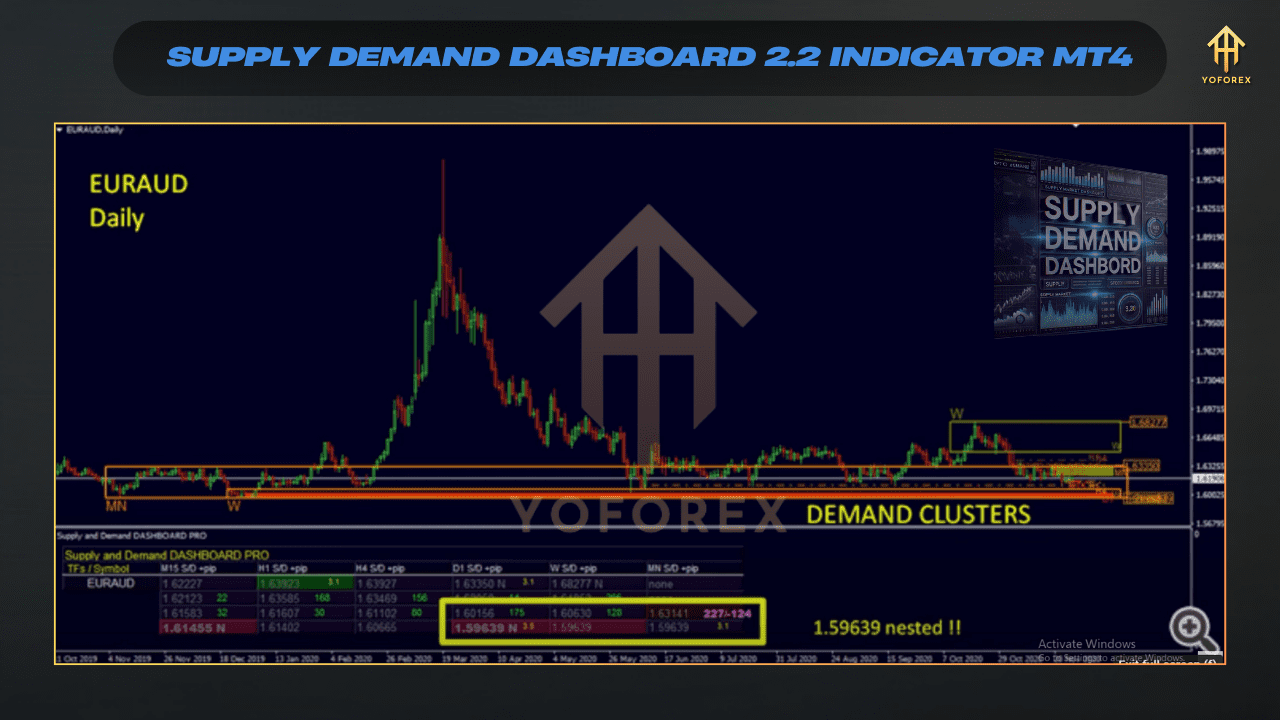
The Supply Demand Dashboard V2.2 Indicator is an advanced indicator developed for MetaTrader 4 (MT4) that automatically detects and displays strong supply and demand zones. It allows traders to monitor multiple currency pairs and timeframes from a single dashboard, providing a clear and concise view of market dynamics.
This indicator helps traders recognize where institutional traders place their orders, allowing them to align their trades with smart money movements. The dashboard ensures traders never miss potential trading opportunities by highlighting real-time price action relative to supply and demand levels.
Key Features of the Supply Demand Dashboard V2.2 Indicator
- Scans multiple timeframes simultaneously.
- Helps traders identify high-impact supply and demand zones on various chart intervals.
- Displays multiple currency pairs and their respective supply/demand levels.
- Allows customization to match individual trading preferences.
- Sends notifications via email, pop-up, or mobile alerts.
- Ensures traders never miss critical trading zones.
- Automatically marks strong supply and demand areas on the chart.
- Identifies fresh and retested zones for strategic entries.
- Designed for both beginner and experienced traders.
- Simple, clean, and easy-to-read dashboard for quick decision-making.
How to Use the Supply Demand Dashboard V2.2 Indicator
Step 1: Install the Indicator
- Download and install the indicator on your MT4 trading platform.
- Attach it to your preferred trading chart.
Step 2: Configure the Settings
- Select the currency pairs and timeframes you want to monitor.
- Customize alert preferences and visual display settings.
Step 3: Identify Key Zones
- Observe the dashboard for highlighted supply and demand zones.
- Look for fresh, strong zones that have not been retested for high-probability trades.
Step 4: Plan Your Trades
- Enter buy trades at strong demand zones where prices are expected to rise.
- Enter sell trades at strong supply zones where prices are likely to decline.
- Set stop-loss orders slightly beyond the zones for risk management.
Step 5: Monitor & Execute
- Use the real-time alerts and price action confirmation for trade execution.
- Adjust strategies based on market movements and key economic events.
Benefits of Using the Supply Demand Dashboard V2.2 Indicator
- Eliminates manual chart scanning.
- Saves time by providing real-time updates across multiple assets.
- Identifies strong price levels where reversals are likely.
- Helps set better stop-loss and take-profit levels.
- Can be integrated with price action, trend-following, and breakout strategies.
- Suitable for scalping, intraday, swing, and long-term trading.
- Provides clear visual cues to confirm trade setups.
- Supports decision-making with historical data and real-time alerts.
Recommended Settings for Optimal Performance
- Timeframes: M15, H1, H4, and D1 for a balanced analysis.
- Currency Pairs: Major pairs like EUR/USD, GBP/USD, USD/JPY, and commodities like Gold (XAU/USD).
- Alerts: Enable pop-up and mobile alerts for timely trade execution.
- Zone Sensitivity: Adjust zone sensitivity based on market volatility for precise entry points.
Join Our Telegram
You Can visit other Websites & Download this Bot
https://www.fxcracked.org/product/supply-demand-dashboard-v2-2-indc/
 Happy Trading


There are no reviews yet.