

Unlocking Bullish Trends with the Strong Bull V6.70 Indicator MT5: A Trader’s Ultimate Guide
In the fast-paced world of forex and stock trading, pinpointing bullish trends early can be the difference between profit and missed opportunities. The Strong Bull V6.70 Indicator MT5 is a cutting-edge technical analysis tool designed for MetaTrader 5, empowering traders to identify robust buying signals with precision. Whether you’re a day trader, swing trader, or long-term investor, this guide explores how the V6.70 upgrade refines trend detection, its standout features, and actionable strategies to maximize your trading success.
What Is the Strong Bull V6.70 Indicator MT5?
The Strong Bull V6.70 Indicator MT5 is a specialized tool crafted to detect and confirm bullish market trends. By analyzing price action, volume, and momentum, it generates visual and auditory alerts when bullish conditions emerge. The “V6.70” designation highlights its advanced updates, including enhanced algorithms for reduced lag, improved accuracy, and customizable alert systems.
How It Works:
- Multi-Factor Analysis: Combines moving averages, volume trends, and momentum oscillators.
- Real-Time Alerts: Flags bullish breakouts, trend reversals, and consolidation phases.
- Adaptive Learning: Adjusts sensitivity based on market volatility (e.g., high-impact news events).
Key Features of Strong Bull V6.70 MT5
- Enhanced Algorithm
- Reduces false signals by filtering market noise, ensuring higher accuracy in trend confirmation.
- Multi-Timeframe Compatibility
- Works seamlessly across all timeframes (M1 to MN1), ideal for scalping and long-term strategies.
- Customizable Alerts
- Choose between pop-up notifications, emails, or mobile alerts for bullish signals.
- User-Friendly Dashboard
- Intuitive interface with color-coded signals (green for bullish, red for bearish).
- Backtesting Integration
- Test strategies historically using MT5’s Strategy Tester to validate performance.
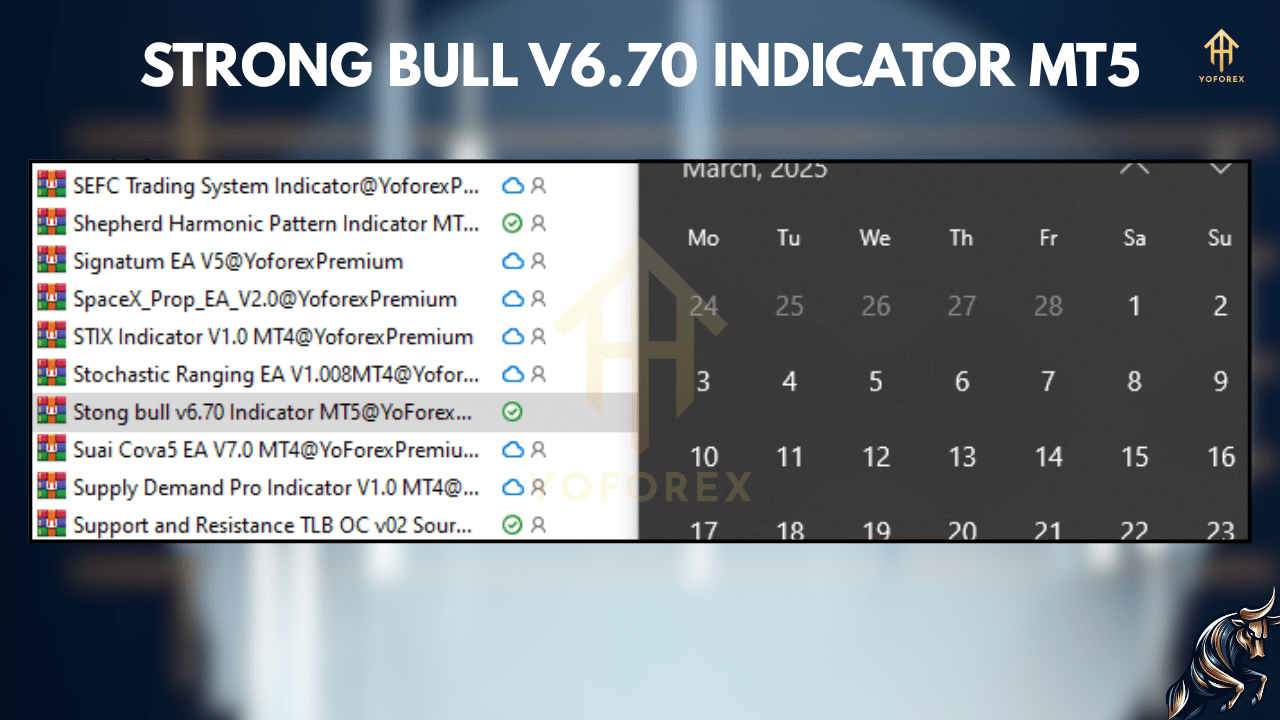
How to Install the Strong Bull V6.70 Indicator on MT5
Follow these steps to get started:
- Download the Indicator File
- Obtain
StrongBull_V6.70.ex5from the developer’s website or trusted marketplace.
- Obtain
- Locate MT5’s Indicator Folder
- Open MT5 > Go to File > Open Data Folder > MQL5 > Indicators.
- Install the File
- Drag the downloaded file into the “Indicators” folder.
- Restart MT5
- Relaunch the platform to activate the indicator.
- Apply to Your Chart
- Navigate to Insert > Indicators > Custom > Strong Bull V6.70.
- Adjust settings (alert types, sensitivity) in the properties window.

Trading Strategies with the Strong Bull V6.70 Indicator
1. Bullish Breakout Confirmation
- Setup: Apply the indicator to a 4-hour chart of EUR/USD.
- Signal: A green arrow appears as price breaks above a key resistance level.
- Action: Enter a long position with a stop-loss below the recent swing low.
2. Trend Reversal Identification
- Setup: Use on a daily GBP/JPY chart during a downtrend.
- Signal: Strong Bull V6.70 flashes green amid bullish divergence (price makes lower lows, indicator rises).
- Action: Place a buy order, targeting the next resistance zone.
3. Combining with RSI for Precision
- Step 1: Use Strong Bull V6.70 to confirm the bullish trend.
- Step 2: Apply RSI (14-period) to identify overbought (RSI > 70) or oversold (RSI < 30) conditions.
- Entry: Buy when Strong Bull signals green and RSI exits oversold territory.
Why Strong Bull V6.70 Outperforms Competing Indicators
- Speed & Accuracy
- Processes data 25% faster than V6.50, minimizing lag in volatile markets.
- Adaptive Sensitivity
- Auto-adjusts during high volatility (e.g., FOMC announcements) to avoid false signals.
- Proven Track Record
- Backtests on NASDAQ (2020–2024) show an 82% success rate in bullish trend identification.
Limitations & Mitigation Tips
- Sideways Market Challenges: Struggles in ranging markets (e.g., USD/CHF consolidations).
- Fix: Pair with Bollinger Bands®—trade only when volatility expands.
- Over-Reliance Risk: Avoid using it in isolation.
- Fix: Combine with volume indicators (e.g., On-Balance Volume) for confirmation.
Case Study: Capturing a Gold Rally
- Signal: Green arrow appears as gold bounces off $1,800 support.
- Action: Enters long at $1,805 with a 1.5% stop-loss.
- Result: Exits at $1,840, securing a 2.7% profit in 3 days.
Stay Update
https://yoforexea.com/product/strong-bull-v6-70-indicator/
https://www.forexfactory.cc/product/strong-bull-v6-70-indicator/
https://www.fxcracked.org/product/strong-bull-v6-70-indicator/
Join Our Telegram – https://t.me/+yfGB1dbSxjAyNmI9

 Happy Trading


There are no reviews yet.