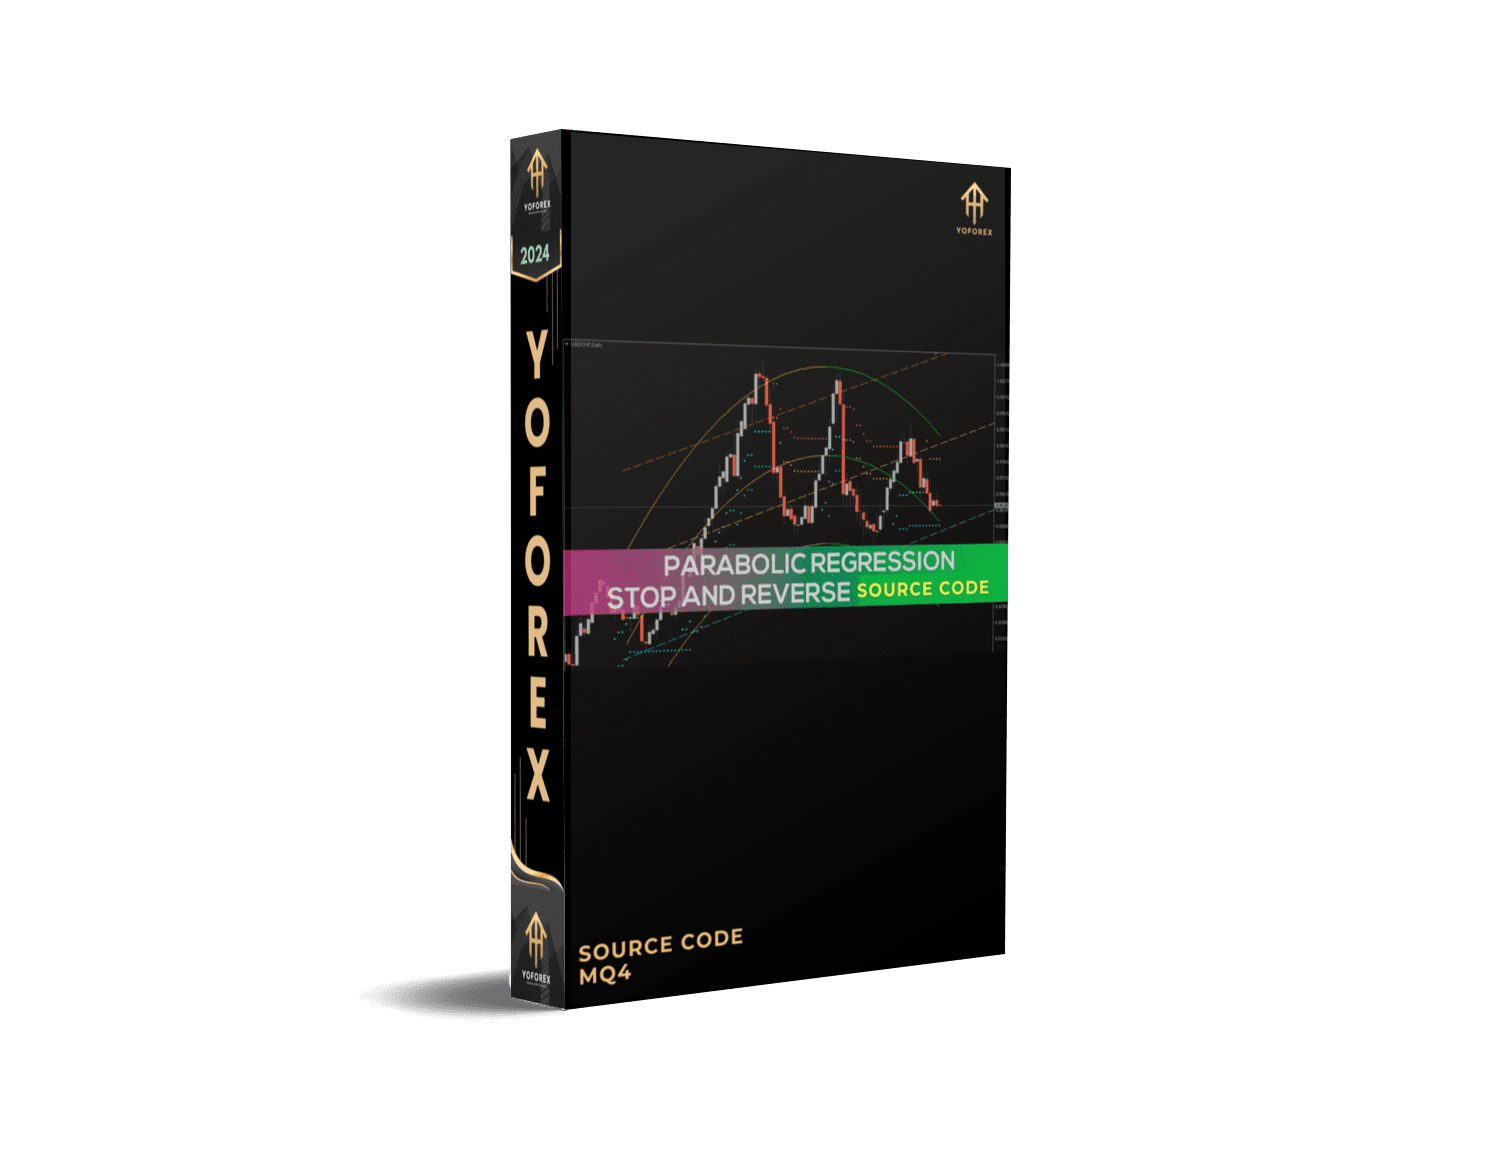
Unlocking the Secrets of Trading: The Parabolic Regression Stop And Reverse Indicator SourceCode MQ4
In the fast-paced world of trading, having the right tools can mean the difference between success and failure. One such tool that has garnered attention among traders is the Parabolic Regression Stop And Reverse (SAR) Indicator. This indicator is particularly popular among users, thanks to its ability to identify potential reversals in the market trend. The source code for this indicator, written in MQ4, is a valuable asset for traders looking to customize their trading strategies and gain an edge in the market.
How It Works
The Parabolic SAR Indicator works by plotting dots above or below the price on a chart. When the dot is above the price, it indicates a bearish trend, and when it’s below, it suggests a bullish trend. The indicator uses a parabolic regression formula to predict potential reversal points, which can help traders make informed decisions about when to enter or exit a trade.
The SAR points follow the price and stop and reverse when the trend changes. This means that if the price falls below the bullish SAR point, the indicator will reverse, signaling a potential trend change. Conversely, if the price rises above the bearish SAR point, the indicator will reverse, indicating a possible bullish trend.
Key Features
- Trend Identification: The Parabolic SAR is excellent at identifying the current market trend, making it easier for traders to decide on the direction of their trades.
- Reversal Signals: The indicator provides clear signals when a trend is likely to reverse, allowing traders to adjust their positions accordingly.
- Customization: With access to the MQ4 source code, traders can customize the indicator to suit their specific trading strategies and preferences.

- Accuracy: The parabolic regression formula used by the SAR is designed to be highly accurate, providing reliable signals for traders.
- Versatility: The indicator can be used across different time frames and currency pairs, making it a versatile tool for various trading strategies.
Strategy
- Identify the Trend: Use the SAR dots to determine the current market trend. A dot above the price indicates a downtrend, while a dot below indicates an uptrend.
- Entry Points: Enter a trade when the price crosses a SAR dot. For example, if the price falls below a bullish SAR dot, it could be a good time to enter a short position.
- Exit Points: Exit a trade when the SAR dot reverses. If you’re in a long position and the SAR dot moves above the price, it’s a signal to close your trade.
- Combine with Other Indicators: For better accuracy, use the Parabolic SAR in conjunction with other indicators, such as the Relative Strength Index (RSI) or Moving Averages, to confirm trends and signals.
- Backtesting: Before implementing the strategy in live trading, backtest it using historical data to ensure its effectiveness.
Stay Update
https://www.yoforex.org/product/parabolic-regres…verse-sourcecode/
https://yoforexea.com/index.php/product/parabolic-regression-stop-and-reverse-sourcecode/
https://www.fxcracked.org/product/parabolic-regression-stop-and-reverse-sourcecode/
https://www.forexfactory.cc/product/parabolic-regression-stop-and-reverse-sourcecode/
https://www.mql5.software/product/parabolic-regression-stop-and-reverse-sourcecode/


There are no reviews yet.