MACD RSI Arrows Indicator MT4: Your Ultimate Trading Tool
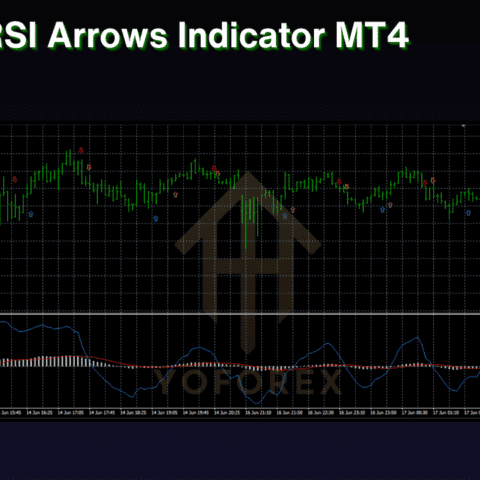
The MACD RSI Arrows Indicator MT4 is a powerful tool designed to enhance your trading experience by providing clear and precise signals. This indicator combines the strengths of the Moving Average Convergence Divergence (MACD) and the Relative Strength Index (RSI) to generate arrows indicating potential buy and sell points. Below, we delve into the essential aspects of this indicator, including the minimum deposit, recommended time frame, suitable currency pairs, and the strategy used for trade execution.
Key Information:
- Minimum Deposit: $100
- Time Frame to Run: M15, H1
- Suitable Currency Pairs: EURUSD, GBPUSD, USDJPY, AUDUSD, NZDUSD
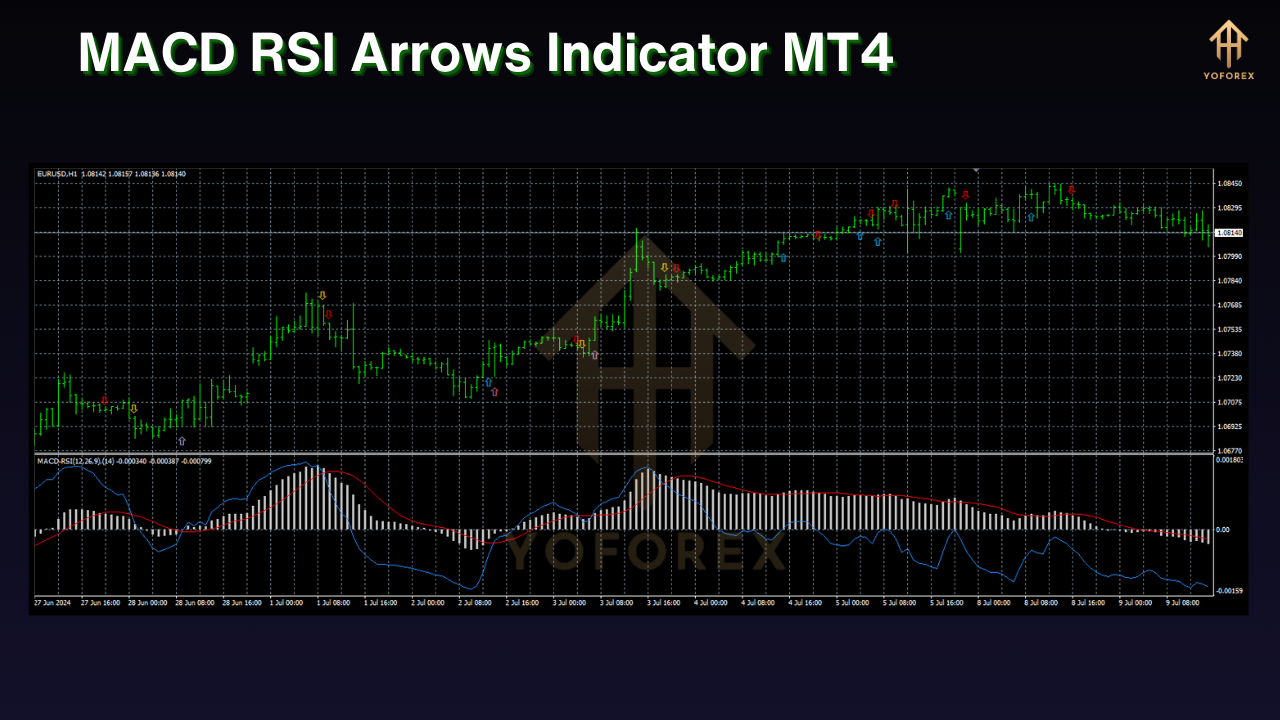
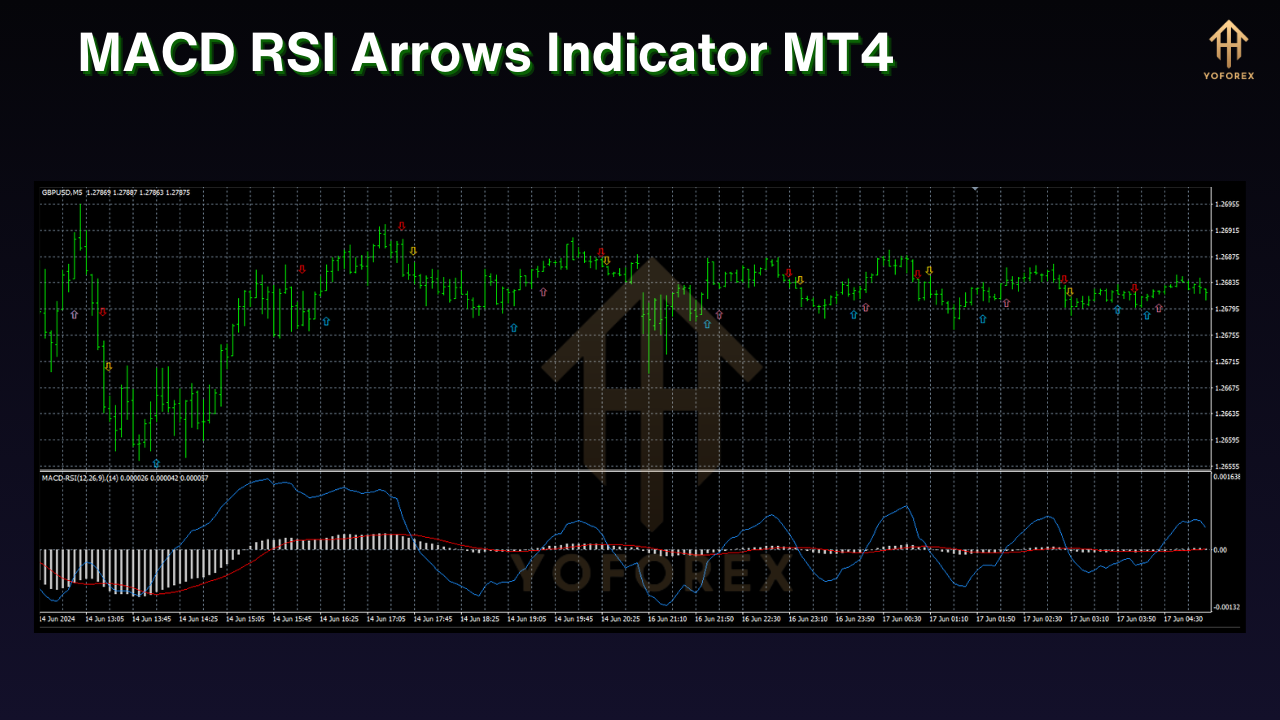
Strategy: How the Indicator Takes Trades
The MACD RSI Arrows Indicator MT4 employs a sophisticated strategy combining the MACD and RSI to generate accurate and timely signals. Here’s how it works:
Strategy Breakdown:
- MACD Component:
- The MACD is a trend-following momentum indicator that shows the relationship between two moving averages of a security’s price.
- It consists of the MACD line, the signal line, and the histogram.
- A buy signal is generated when the MACD line crosses above the signal line.
- A sell signal is generated when the MACD line crosses below the signal line.
- RSI Component:
- The RSI is a momentum oscillator that measures the speed and change of price movements.
- It oscillates between 0 and 100 and is typically used to identify overbought or oversold conditions in a market.
- A reading above 70 indicates that the market is overbought, while a reading below 30 suggests that the market is oversold.
- The indicator combines these readings to filter out false signals from the MACD, ensuring that only the most promising trades are taken.
Execution:
- Buy Trade:
- The indicator generates an upward arrow when the MACD line crosses above the signal line, and the RSI is below 30, indicating a potential reversal from an oversold condition.
- This combination increases the probability of a successful buy trade, leveraging the strengths of both indicators.
- Sell Trade:
- The indicator generates a downward arrow when the MACD line crosses below the signal line, and the RSI is above 70, indicating a potential reversal from an overbought condition.
- This combination enhances the accuracy of sell trades, ensuring that trades are taken in optimal market conditions.
Benefits of Using the MACD RSI Arrows Indicator MT4
- Enhanced Accuracy: By combining two powerful indicators, this tool provides more reliable signals than using MACD or RSI alone.
- Clear Signals: The arrows make it easy to see potential entry and exit points at a glance, reducing the chance of missing trading opportunities.
- Versatility: Suitable for various currency pairs and time frames, making it a flexible tool for different trading styles.
Conclusion
The MACD RSI Arrows Indicator MT4 is an indispensable tool for traders looking to improve their trading performance. By leveraging the strengths of the MACD and RSI, this indicator provides clear and reliable signals, ensuring you can make informed trading decisions. Join our Telegram group for more updates and download the indicator from our website to start enhancing your trading strategy today.
Disclaimer: Trading involves risks, and past performance is not indicative of future results. Always conduct thorough research and seek professional advice before trading.

Stay Updated:
Instant Download: https://yoforexea.com/product/macd-rsi-arrows-indicator/
You can also download from other websites:
https://www.forexfactory.cc/product/macd-rsi-arrows-indicator/
https://www.mql5.software/product/macd-rsi-arrows-indicator/
https://www.yoforex.org/product/macd-rsi-arrows-indicator/
https://www.fxcracked.org/product/macd-rsi-arrows-indc/
Contact: https://t.me/yoforexrobot



 Happy Trading






There are no reviews yet.