Fibonacci Golden Zone Indicator V1.07 MT4 – Your Ultimate Trading Tool
The Fibonacci Golden Zone Indicator V1.07 MT4 is a powerful technical analysis tool that simplifies trading by identifying key Fibonacci levels. Designed for MetaTrader 4 (MT4), this indicator helps traders pinpoint potential areas of price reversal and continuation. Its strategy revolves around Fibonacci retracement and extension levels, providing accurate entry and exit points. In this article, we will explore the minimum deposit, ideal timeframes, and currency pairs to run this indicator on, along with a detailed breakdown of its strategy.
Telegram Link: Join our Telegram
Download the Indicator: Get Fibonacci Golden Zone Indicator V1.07 MT4 here
Key Features
- Platform: MetaTrader 4 (MT4)
- Timeframe: M15, H1
- Currency Pairs: EURUSD, GBPUSD, USDJPY, and other major pairs
- Minimum Deposit: $200
- Strategy: Fibonacci retracement and extensions, price action confirmation

Minimum Deposit: $200
To effectively use the Fibonacci Golden Zone Indicator V1.07, you’ll need a minimum deposit of $200. This amount provides adequate margin and flexibility to execute trades across different timeframes and currency pairs.
Timeframes to Run: M15, H1
This indicator performs optimally on the M15 and H1 timeframes. These timeframes strike a balance between short-term trading opportunities and longer-term trends. They are also ideal for capturing Fibonacci retracements and extensions, offering clear entry and exit points based on market momentum and price action.
- M15: Best for intraday trading, allowing traders to capture multiple opportunities within a day.
- H1: Ideal for swing trading, offering larger market moves and more significant Fibonacci retracements.
Suitable Currency Pairs: EURUSD, GBPUSD, USDJPY
The Fibonacci Golden Zone Indicator is best suited for major currency pairs like EURUSD, GBPUSD, and USDJPY. These pairs exhibit high liquidity and follow technical levels more accurately, making Fibonacci retracement levels highly reliable for these pairs. The indicator can also be used on other major pairs, depending on market conditions.
How the Indicator Works: Fibonacci Strategy Breakdown
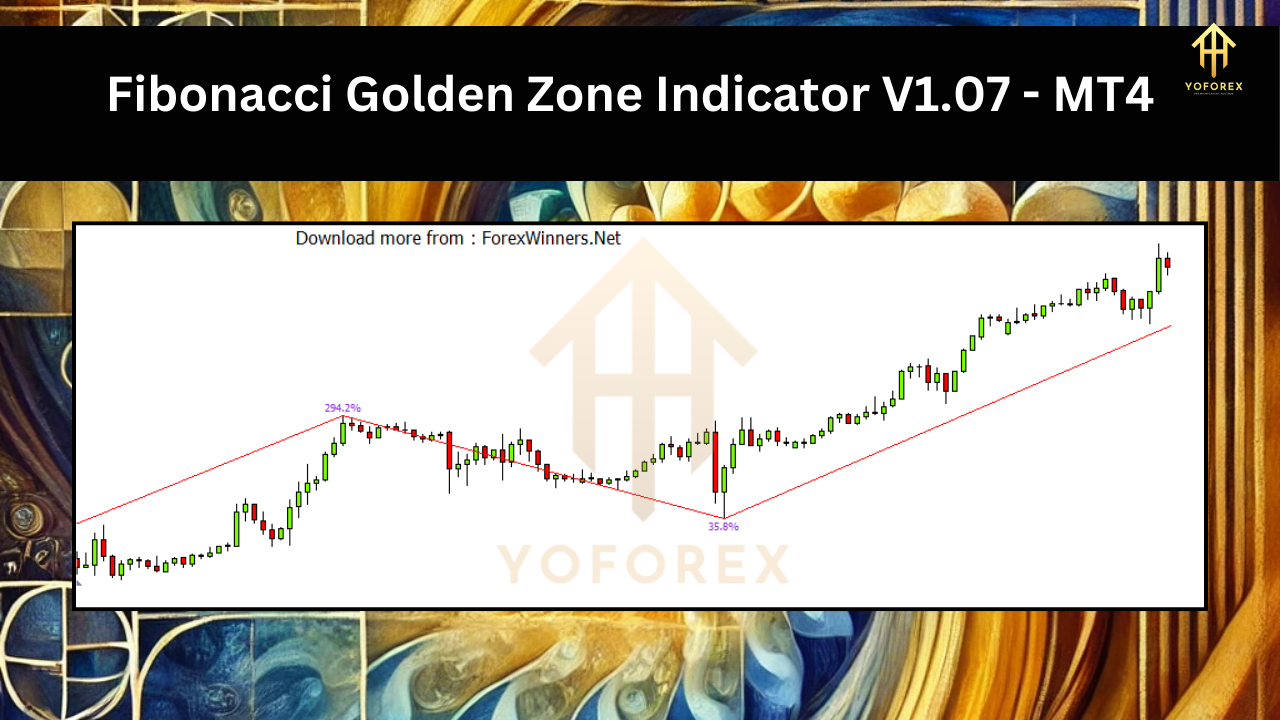
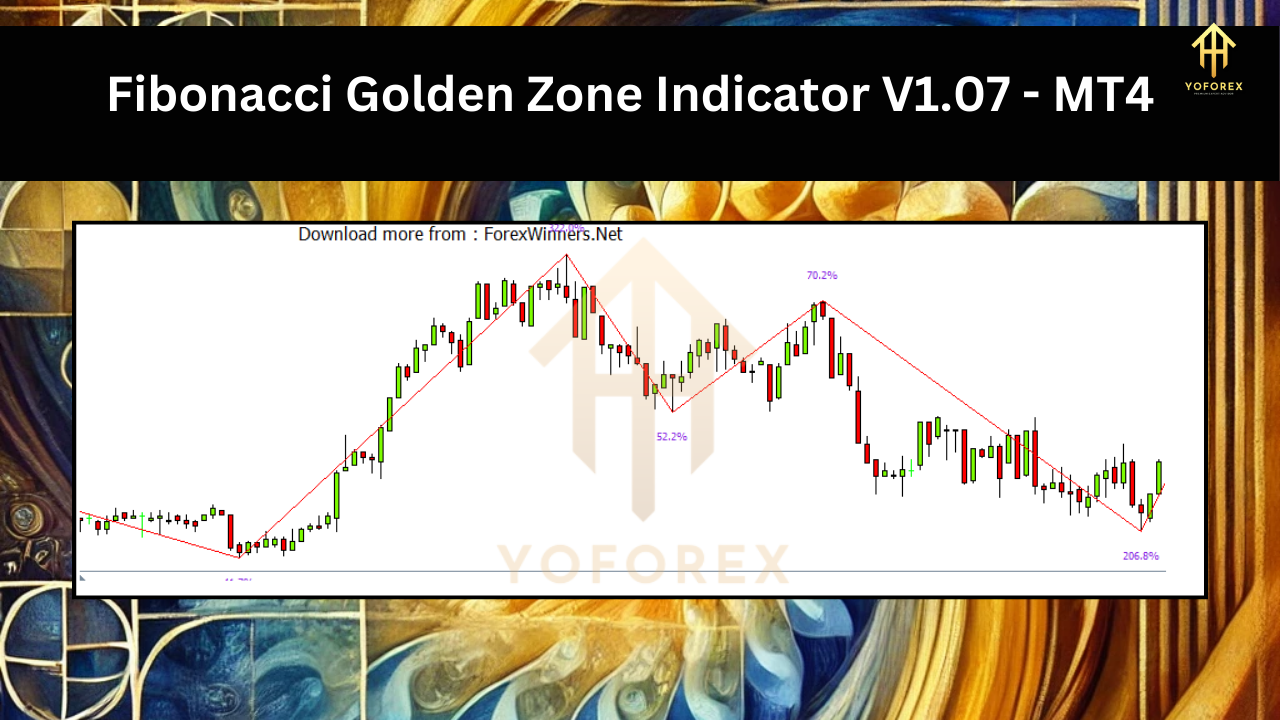
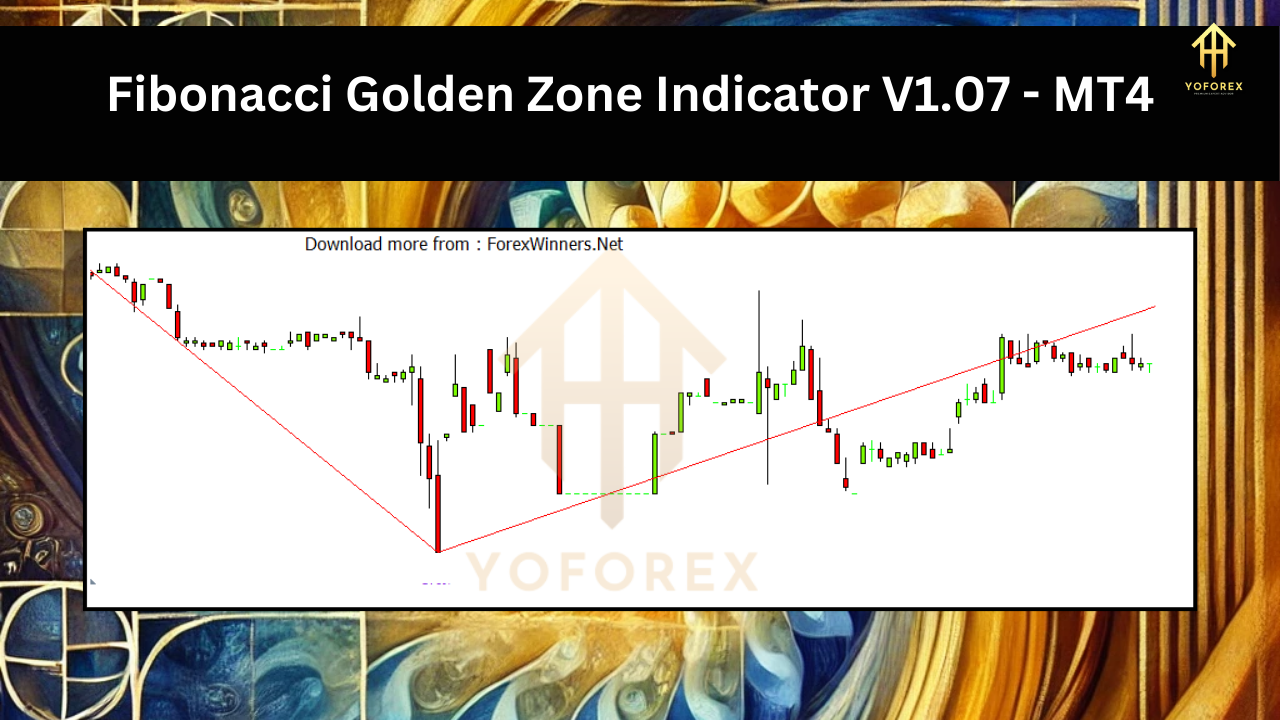
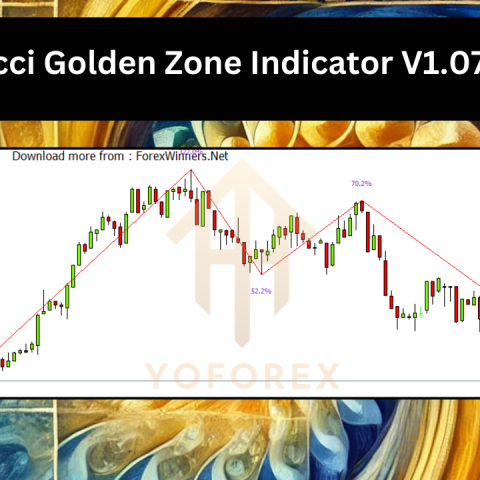
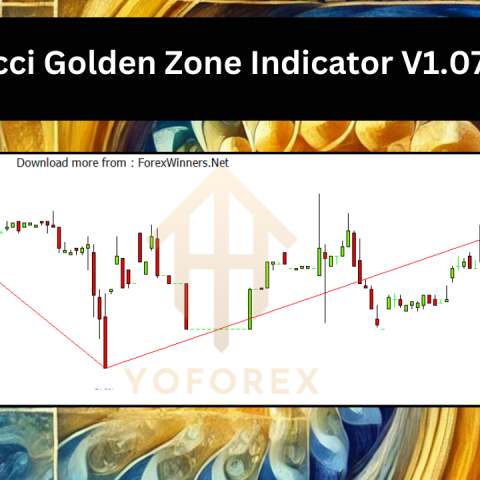
The Fibonacci Golden Zone Indicator V1.07 follows a strategy based on Fibonacci retracement and extension levels. These levels are calculated based on price swings, identifying potential areas where the price might reverse or continue its trend. The indicator enhances this strategy by providing visual zones on the chart, highlighting areas with high probability for trade setups.
Here’s a step-by-step breakdown of how this strategy works:
1. Identifying the Price Swing
The indicator automatically plots Fibonacci levels from significant price swings in the market. A swing high to swing low (in a downtrend) or a swing low to swing high (in an uptrend) is used to draw the retracement levels. The key Fibonacci levels that are plotted include 23.6%, 38.2%, 50%, 61.8%, and 78.6%.
- Uptrend: When the price moves higher and then retraces, the Fibonacci levels provide potential zones where the price might bounce and continue the uptrend.
- Downtrend: When the price drops and then retraces upwards, Fibonacci levels act as resistance zones where the price may resume its downtrend.
2. Golden Zone Highlight
The indicator highlights the “Golden Zone”, which ranges between 61.8% and 78.6% retracement levels. This area is known for having a high probability of a price reversal. Traders look for buy setups near the 61.8% level in an uptrend and sell setups near the 61.8% level in a downtrend. The Golden Zone is essential for identifying the precise point of a reversal, increasing the accuracy of trade entries.
3. Price Action Confirmation
To improve the reliability of the trade, the indicator often works best with price action confirmation. Once the price reaches the Golden Zone, traders should look for candlestick patterns such as:
- Bullish Engulfing (in an uptrend near the Golden Zone)
- Bearish Engulfing (in a downtrend near the Golden Zone)
- Pin bars or doji candles to confirm potential reversals.
These patterns increase the probability that the market will react strongly to the Fibonacci level, confirming the trade setup.
4. Take-Profit and Stop-Loss Levels
After identifying the trade setup, traders can set take-profit (TP) and stop-loss (SL) levels based on Fibonacci extensions or key market structure levels.
- Take-Profit: Common take-profit levels are the 161.8% and 261.8% Fibonacci extension levels, which are plotted by the indicator beyond the price swing. These levels help maximize gains in trending markets, capturing larger price moves.
- Stop-Loss: The stop-loss should be placed below (for buy trades) or above (for sell trades) the 78.6% Fibonacci level or at the previous swing high/low. This keeps risk minimized and ensures the trade stays within a reasonable risk-reward ratio.
5. Trailing Stop Strategy
For traders seeking to lock in profits, the indicator can be combined with a trailing stop strategy. Once the price moves in the trade’s favor, a trailing stop can be set to follow the price action. This allows traders to secure profits without being stopped out prematurely during minor retracements.
The Fibonacci levels can be used to adjust the trailing stop manually. As the price hits each Fibonacci extension level, the stop-loss can be moved to the next Fibonacci level, locking in additional profits as the trade progresses.
Example of a Trade Setup Using the Fibonacci Golden Zone Indicator
Let’s look at a typical buy trade setup using the Fibonacci Golden Zone Indicator:
- Price Swing Identification: In an uptrend, the price moves from a swing low to a swing high.
- Fibonacci Levels Plotted: The indicator automatically plots Fibonacci levels on the retracement.
- Golden Zone Testing: The price retraces and tests the Golden Zone (between 61.8% and 78.6% levels).
- Price Action Confirmation: A bullish engulfing candle forms at the 61.8% retracement level, confirming a buy entry.
- Entry and Stop-Loss: Enter a buy trade at the close of the bullish candle. Place the stop-loss just below the 78.6% retracement level.
- Take-Profit: Set the take-profit level at the 161.8% extension level.
- Trade Management: As the price moves in your favor, adjust the trailing stop to secure profits.
Why Choose Fibonacci Golden Zone Indicator V1.07 MT4?
- Accurate Trade Entry: The indicator highlights high-probability zones for trade entries, especially the Golden Zone between 61.8% and 78.6%.
- Flexible Timeframes: Works efficiently on both short-term (M15) and long-term (H1) timeframes, providing opportunities for both day traders and swing traders.
- Broad Currency Pair Applicability: Ideal for major pairs like EURUSD, GBPUSD, and USDJPY, ensuring reliable performance in liquid markets.
- Risk Management: The indicator allows for clear placement of stop-loss levels, keeping risk under control.
Conclusion
The Fibonacci Golden Zone Indicator V1.07 MT4 is a robust tool for traders looking to enhance their trading strategy with Fibonacci retracement levels. By focusing on the Golden Zone, traders can find optimal entry points and manage risk effectively. Its ease of use, combined with powerful price action confirmation, makes it a must-have for both novice and experienced traders.
Join Our Telegram for Updates and Support: https://t.me/yoforexrobot
Please Join: https://t.me/+M-kFQePDgy5lZjY1
Stay Updated:
Instant Download: https://www.yoforex.org/product/fibonacci-golden-zone-indicator-v1-07/
https://yoforexea.com/product/fibonacci-golden-zone-indicator-v1-07/
https://www.fxcracked.org/product/fibonacci-golden-zone-indicator-v1-07/
https://www.forexfactory.cc/product/fibonacci-golden-zone-indicator-v1-07/
https://www.mql5.software/product/fibonacci-golden-zone-indicator-v1-07/


 Happy Trading





There are no reviews yet.