Volume Profile Indicator V1.01 MT4 – A Complete Beginner-Friendly Guide
If you’ve been trading for a while, you’ve probably heard traders talk about “where the real volume sits” or “market’s point of control.” And honestly, that kind of information can change the way you enter, exit, or even look at charts. The Volume Profile Indicator V1.01 MT4 is built exactly for this purpose. It’s one of those tools that quietly gives you an unfair edge—coz it highlights the areas where price reacted the most, the levels where traders fought, and zones where the market actually cares.
Unlike traditional volume indicators that simply show bars at the bottom of your chart, the Volume Profile Indicator shows volume at each price level. This means you can see which price acted like a magnet for buyers and sellers. This isn’t just visually satisfying—it’s genuinely helpful for building smarter trade plans.
In this blog, we’ll break down how the indicator works, why traders rely on it, what makes it useful for MT4 users, and how you can apply it in your daily trading. And don’t worry—I'll keep things simple, practical, and as real as possible.
What Exactly Is the Volume Profile Indicator V1.01 MT4?
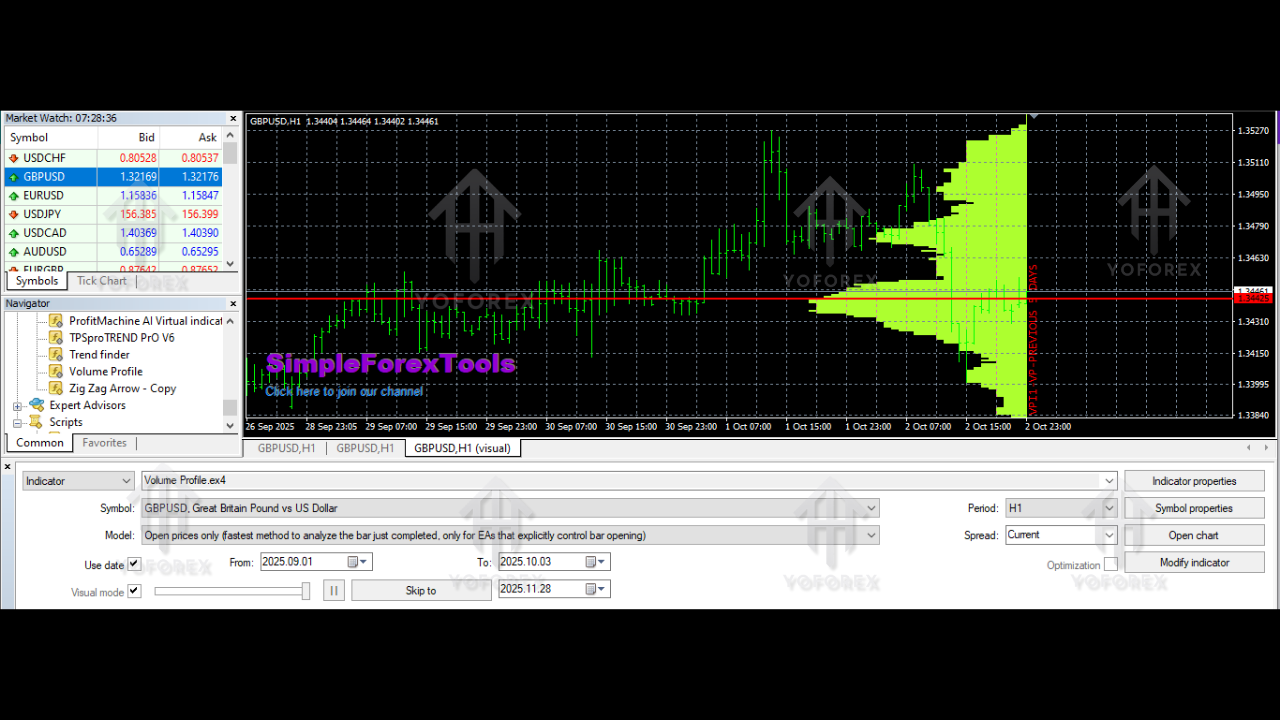
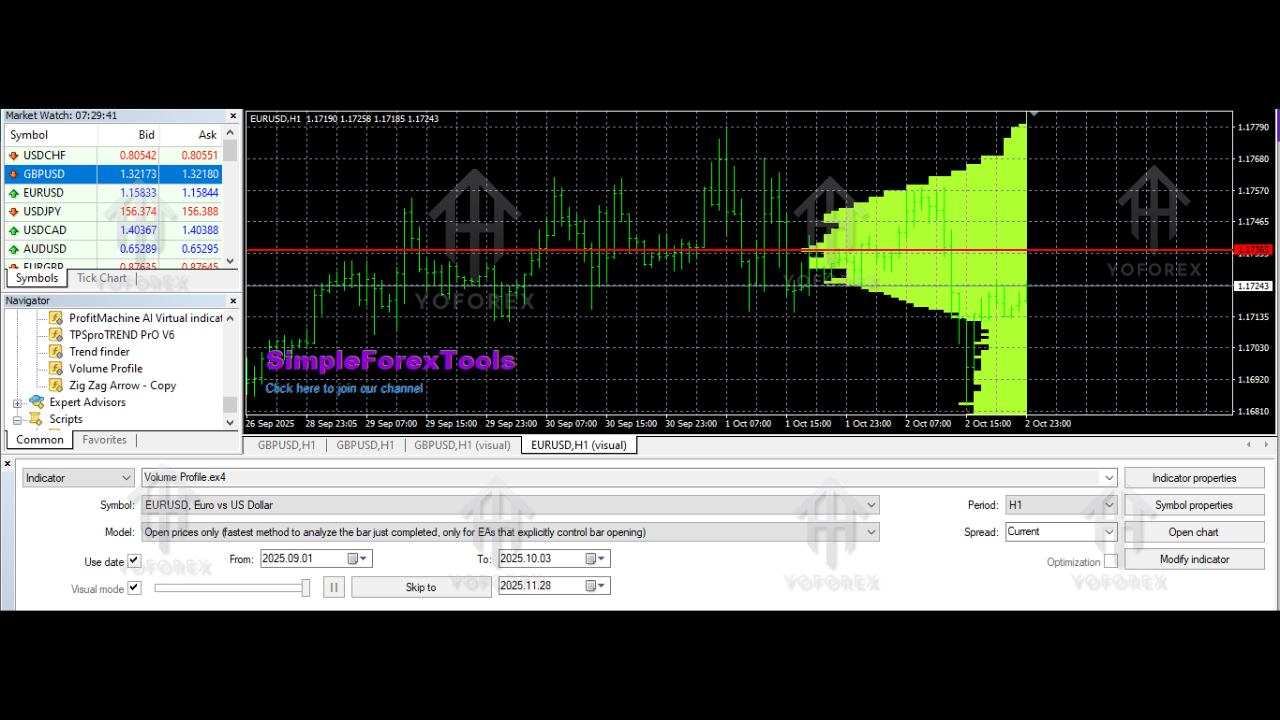
The Volume Profile Indicator V1.01 MT4 is a custom tool designed to analyze historical price action along with the total volume traded at each price level. Instead of showing volume per candle, it stacks the volume vertically—giving you a histogram on the right side of your chart.
The longer a horizontal bar is, the more trading activity occurred at that exact price. This helps traders identify:
• High-volume areas
• Potential support and resistance
• Value zones
• Breakout levels
• Points where the market might reverse or continue
A lot of traders call it “Market Profile,” although technically Market Profile focuses on time-price opportunity (TPO), while Volume Profile focuses strictly on traded volume. Still, the concept and the insights feel very similar.
The best thing about this indicator is that it scans a set number of bars you define. Want volume data for the last 100 candles? No problem. Prefer the last 1,000 bars? Easy. This flexibility helps traders using different strategies—scalpers, intraday traders, swing traders, even long-term position traders.
Why Is Volume Profile So Important?
Support and resistance levels are the backbone of technical analysis. But most traders draw them based on:
• visible highs and lows
• trendlines
• Fibonacci levels
• price zones
Nothing wrong with that… but these methods ignore where actual trading activity took place. Price might touch a level, but if no volume was there, it means the market didn’t care much.
Volume Profile changes that.
It gives you the true story behind the price.
A price level with heavy volume usually means:
- Buyers and sellers agreed this price was “fair.”
- Market participants placed big orders there.
- The level may act as strong support or resistance in the future.
Knowing this helps you place better stop-losses, entries, and take-profits. It also helps you avoid weak levels that won’t hold under pressure.
Key Features of the Volume Profile Indicator V1.01 MT4
Here are the main things that make this indicator so useful:
• Displays a vertical histogram showing traded volume at each price
• Accurately identifies high-volume nodes and low-volume nodes
• Helps detect strong support and resistance zones
• Allows scanning of any number of previous bars (you choose the range)
• Can show the profile up to the latest candle or up to any past date
• Clean interface compatible with MT4
• Works with any currency pair, gold, crypto, indices, and stocks
• Lightweight and doesn’t lag charts even on lower timeframes
• Useful for scalpers and swing traders alike
The indicator highlights “price acceptance” and “price rejection” zones—something that’s extremely important in any trading strategy.
How the Volume Profile Indicator Works
When the indicator scans the defined number of historical bars, it calculates how much volume was traded at every price level. If a price attracted high trading activity, the volume bar at that level stretches longer. If the price didn’t attract much interest, the bar stays short.
The three most important areas are:
1. Point of Control (POC)
This is the price with the highest traded volume. It often acts as a magnet for price.
2. High Volume Nodes (HVN)
These are big cluster areas—strong support and resistance.
3. Low Volume Nodes (LVN)
These are thin areas where price moved quickly. Breakouts often happen here.
Most traders use Volume Profile to plan their trades around these zones.
How Volume Profile Helps You in Real Trading
Let’s break it down in practical terms.
1. Identifying Strong Entry Zones
If price approaches a high-volume area that acted as support before, you may consider a buy setup (depending on your strategy).
2. Better Stop Loss Placement
Stop losses placed just beyond high-volume zones are more reliable. Price usually respects these.
3. Detecting Breakouts
When price enters a low-volume zone, it tends to travel fast. Traders use this for momentum trades.
4. Spotting Reversals
If price repeatedly rejects a high-volume node, that’s often a strong reversal zone.
5. Avoiding “Fake Levels”
Not all highs/lows are real levels. If they lack volume, they may not hold.
Volume Profile filters these fake structures for you.
Who Should Use Volume Profile Indicator V1.01 MT4?
It’s surprisingly flexible and suits:
• Scalpers (M1, M5, M15)
• Day traders
• Swing traders
• Position traders
• Smart Money Concept traders
• Supply and demand traders
• Breakout traders
Its ability to reveal hidden support and resistance makes it valuable regardless of strategy.
If you’re someone who likes clear market logic instead of guessing, this tool is perfect for you.
How to Use the Indicator (Simple Steps)
- Download the indicator and add it to your MT4
- Go to Insert → Indicators → Custom → Volume Profile V1.01
- Choose how many previous bars you want to scan
- Adjust colors and width as you prefer
- Look at:
• POC
• High volume zones
• Low volume zones - Build your trade logic around these areas
Even beginners can understand it within a few minutes.
Tips for Trading With Volume Profile
Here are some practical tips you’ll find helpful:
• Never trade against POC rejection
• Use Volume Profile along with trend structure
• Mix it with candlestick confirmation
• Always zoom out to see bigger volume shifts
• Don’t use it alone—combine with risk management
• HVNs usually slow down price
• LVNs usually speed up price
Once you get used to watching volume levels, your chart-reading confidence will naturally improve.
Final Thoughts
The Volume Profile Indicator V1.01 MT4 is one of those rare tools that adds real depth to your technical analysis without complicating your charts. It helps you see where big money stepped into the market, where prices are likely to bounce, and where breakouts may happen. Whether you’re a beginner or someone who has been trading for years, understanding volume at price levels can transform the way you plan trades.
Comments
Leave a Comment