
Volume is the lifeblood of any market—without it, price action’s just empty noise. But if you’ve ever found yourself squinting at charts wondering whether that surge in price was backed by real conviction or just a flash in the pan, you’re not alone. That’s where the Volume Oscillator Indicator V1.0 MQ5 comes in. It’s designed to give you a clear, visual read on shifts in trading volume momentum…so you know when smart money’s stepping in (or quietly slipping out).
In this post, we’ll walk you through what the Volume Oscillator is, how it calculates its values, the key signals you’ll want to watch for, recommended settings, and a few practical ways to plug it into your MT5 workflow. By the end, you’ll see why this free MQ5 indicator might just become your go-to volume gauge.
What Is the Volume Oscillator Indicator?
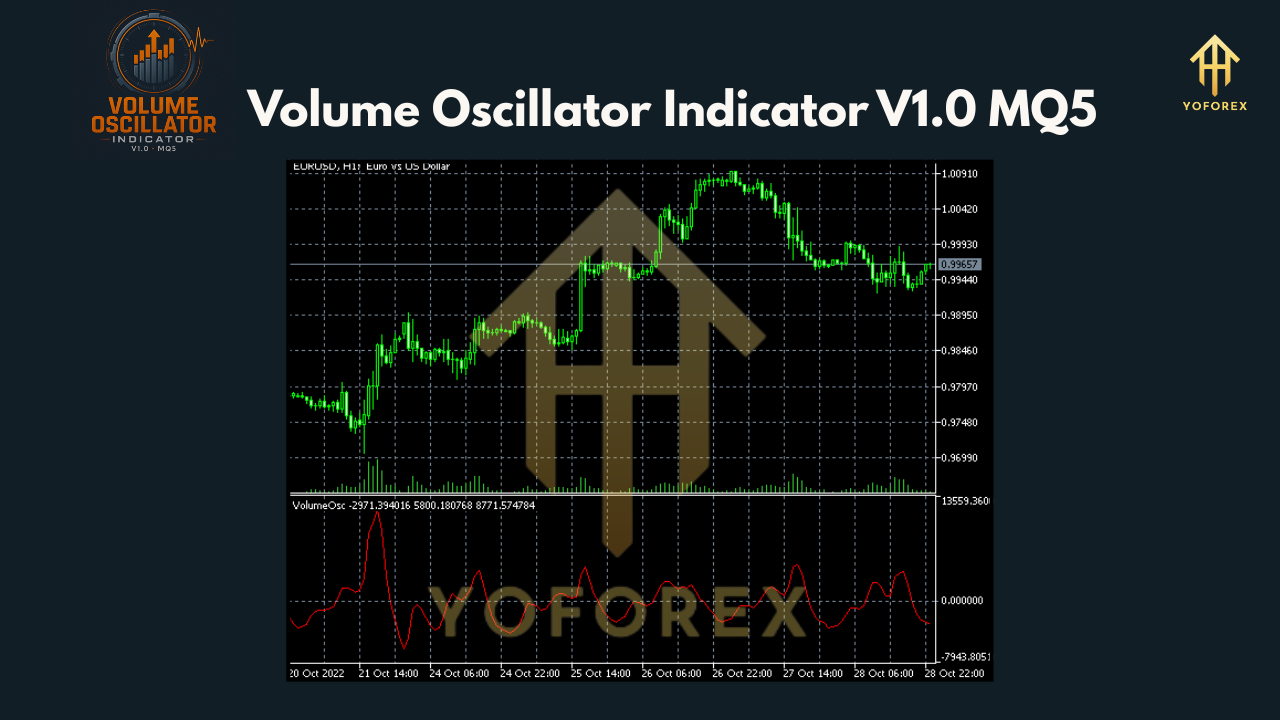
At its core, the Volume Oscillator measures the difference between two moving averages of volume—usually a faster (shorter period) MA and a slower (longer period) MA. When the short MA crosses above the long one, it signals increasing volume momentum. When it dips below, momentum’s waning. Simple, right? Yet, despite the straightforward math, many traders overlook this powerful confirmation tool…coz they’re too busy tracking price moves alone.
By plotting that difference as an oscillator—above and below a zero line—you get a neat, intuitive readout:
- Above zero: Bullish volume momentum (buyers stepping up)
- Below zero: Bearish volume momentum (sellers in control)
It’s kinda like having a stethoscope on the market’s heartbeat.
How It Works (The Formula)
Under the hood, the MQ5 code does this:
- Calculates a Fast Volume MA over N₁ periods.
- Calculates a Slow Volume MA over N₂ periods.
- Subtracts: Volume Oscillator = Fast MA – Slow MA.
- Optionally, plots a signal line or histogram for clearer crossovers.
You choose the periods N₁ and N₂—common defaults are 14 and 28. But you’ll wanna tweak ‘em based on your trading timeframe. More on that in a sec.
Interpreting Signals
• Crossovers: The bread-and-butter. When the oscillator crosses above zero, that uptick signals fresh buying interest—maybe a good time to look for bullish chart patterns. Conversely, a drop below zero warns of weakening demand—time to tighten stops or scout for short setups.
• Divergences: If price makes a new high but the Volume Oscillator tops out lower, that bearish divergence flags possible exhaustion. Same for bullish divergence on new lows.
• Trend Confirmation: Pair the oscillator with your moving averages on price. If price is above its 50 MA and the Volume Oscillator stays positive, that corroborates the uptrend’s strength.
Play around, coz different markets show different quirks. But once you get the hang of these basic reads, you’ll never view volume quite the same way.
Key Benefits
- Clarity: No guessing whether volume spikes are meaningful; you see momentum shifts at a glance.
- Versatility: Works across FX, indices, commodities…whatever you trade on MT5.
- Lightweight: MQ5 file is small, loads instantly—zero lag.
- Customizable: Tweak MA types (SMA, EMA…), periods, and colors to match your style.
- Free: Yup, zero cost; ideal for traders on a budget.
Recommended Settings
Here’s a starter pack—feel free to adjust:
- Fast MA Period: 14
- Slow MA Period: 28
- MA Type: Exponential (for faster response)
- Histogram Mode: On (for visual impact)
- Colors: Up bars green; down bars red
- Apply to: Volume default
On higher timeframes (H4, D1), you might bump the Slow MA to 50 or even 100. On intraday (M15, M5), you could tighten both periods by half. The key is balance—you want responsiveness without too much whipsaw.
Installing on MT5
- Download the
Volume_Oscillator_V1.0.mq5from the official link. - Open MetaTrader 5. Go to File → Open Data Folder → MQL5 → Indicators.
- Paste the MQ5 file into that folder.
- Restart MT5.
- In the Navigator panel, find Indicators → Volume Oscillator V1.0 MQ5.
- Drag it onto your chart, tweak the inputs, and click OK.
You’ll see the oscillator panel appear beneath price. If you want a screenshot of recommended settings, just drop a comment below and I’ll share one!
Practical Trading Strategies
- 1. Trend Pullback Entries: In a strong uptrend, wait for the Volume Oscillator to dip slightly below zero on a pullback, then cross back above. Combine with support zones for tighter stops.
- 2. Breakout Confirmations: When price breaks a key level, check the oscillator. A simultaneous swing above zero means volume’s backing the move—higher win probability.
- 3. Fade Exhaustion Moves: If price rockets up but the oscillator fails to cross positive or quickly turns down, consider a quick reversal scalp.
- Remember: no indicator’s perfect. Always manage risk, and ideally use this alongside price action or other tools.
Risk Management & Tips
- Don’t chase spikes. Wait for clear crossovers or divergences.
- Use stops. Volume signals can lag in fast markets—price can overshoot.
- Backtest. Run the oscillator on your favorite pairs & timeframes to build confidence.
- Combine. It plays brilliantly with RSI, MACD, or trendlines.
Conclusion
The Volume Oscillator Indicator V1.0 MQ5 is a no-frills yet powerful way to bring volume momentum into your trading edge. Once you see how it clarifies market intent, you’ll wonder how you ever traded without it. So go ahead, install it on your MT5, experiment with settings, and let it guide you to smarter entries and exits.
Join our Telegram for the latest updates and support


Comments
Leave a Comment