TARGET BANDS Indicator MQ4 for EURUSD (M30): Practical Guide
If you’ve been searching for a clean, rules-based way to read volatility and structure on EURUSD—without cluttering your chart—the TARGET BANDS Indicator MQ4 is a solid pick. On the M30 timeframe it can quickly show you when price is expanding, when it’s fading back to equilibrium, and where the high-probability zones for continuation or mean reversion might be. In this guide, you’ll learn what the indicator does, how to install it in MT4, suggested settings for EURUSD M30, and step-by-step trade ideas you can test right away.
What is the TARGET BANDS Indicator?
At its core, TARGET BANDS wraps price with upper and lower dynamic envelopes (or “bands”) built around a smoothed baseline—often an EMA or SMA—then spaces the bands using a volatility measure such as ATR or standard deviation. When volatility expands, the bands widen; when markets compress, they contract. This makes the tool great for two popular playbooks:
- Trend continuation: ride price as it walks the outer band in the trend direction.
- Mean reversion: fade short-term extensions back toward the midline when the market is range-bound.
On EURUSD M30, you’ll frequently see sessions where price hugs one side of the bands during London or New York overlap, then snaps back toward the middle as momentum cools. TARGET BANDS helps you visualize both phases clearly so you don’t force trades in the wrong regime.
Why EURUSD on the M30 Timeframe?
- Liquidity and consistency: EURUSD is deep and relatively stable, which makes band-based signals more reliable than on thin or spiky pairs.
- Session rhythm: M30 neatly captures intra-day swings—long enough to filter noise, short enough to find two to four clean opportunities per session.
- Spread efficiency: On a low-spread broker, M30 signals can maintain healthy reward-to-risk after costs.
Installation (MT4)
- Copy the file: Place
TARGET_BANDS.mq4(or.ex4) intoMQL4/Indicatorsinside your MT4 data folder. - Compile (if needed): In MetaEditor, open the file and press Compile.
- Attach to chart: Restart MT4, open EURUSD, set timeframe to M30, and drag TARGET BANDS from the Navigator onto the chart.
- Set your parameters: See the suggested starting values below.
- Save a template: Right-click the chart → Template → Save to reuse the layout quickly.
Suggested Settings for EURUSD (M30)
Use these as a baseline, then optimize to your broker and style:
- Baseline MA Type: EMA
- Baseline Period: 50
- Volatility Type: ATR
- ATR Period: 14
- ATR Multiplier: 1.9 to 2.2 (start at 2.0)
- Price Source: Close
- Smoothing: 1 (or off)
- Shift: 0
- Alerts: On for band touches/breaks and midline cross (optional)
Why these numbers? A 50-EMA midline keeps you aligned with the session trend without reacting to every minor wiggle. ATR(14) with ~2.0 multiplier tends to balance false breaks vs. missed moves on EURUSD M30; tighten to 1.8 in quiet markets or expand to 2.3 in high-vol regimes.
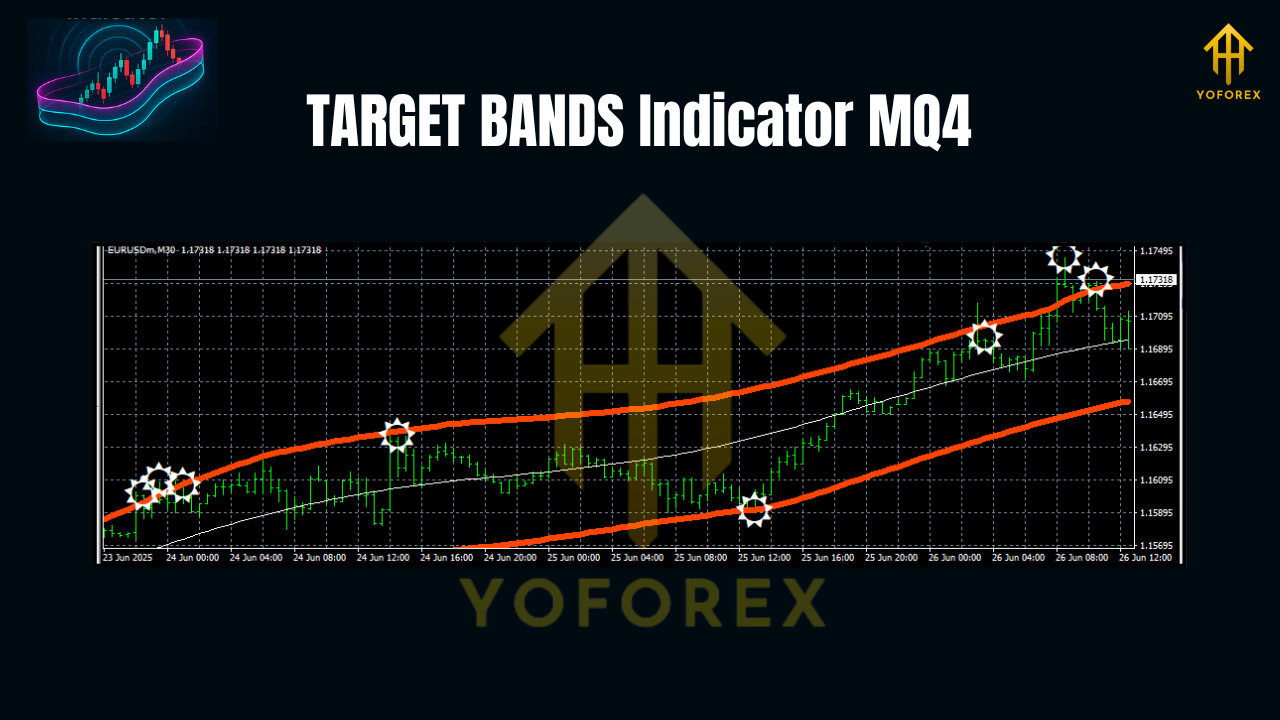
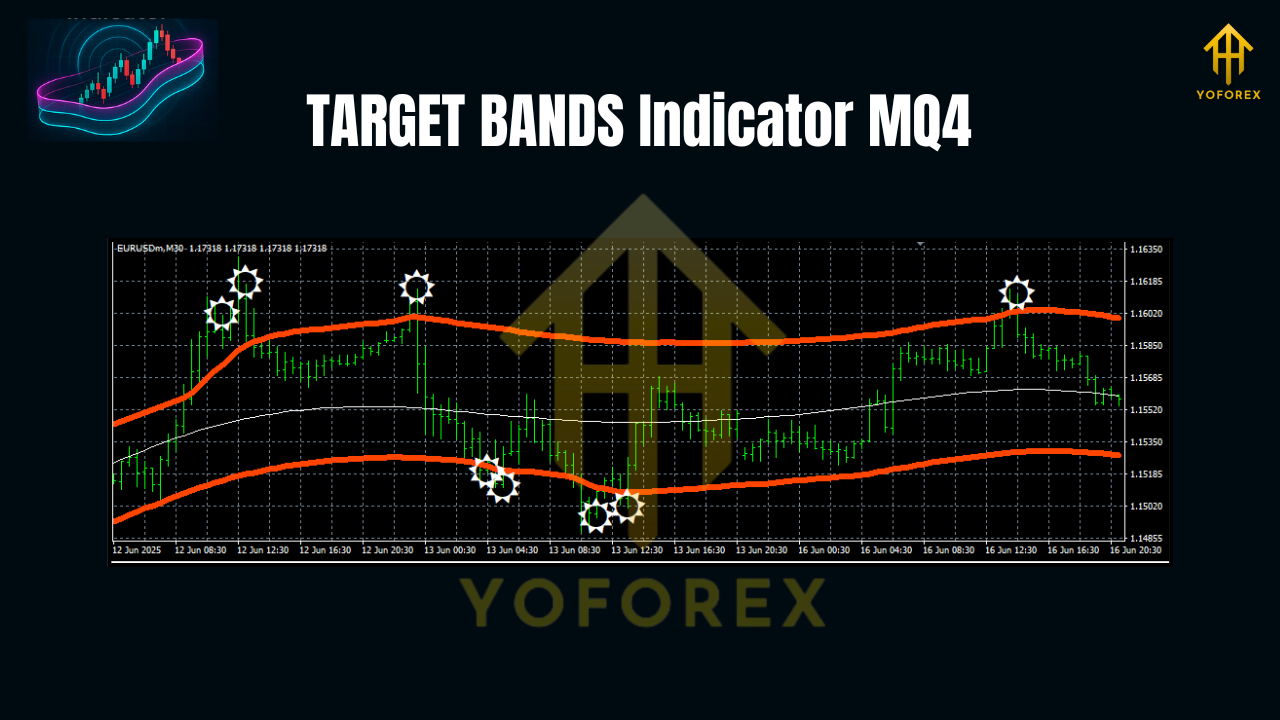
How to Read the Bands
- Outer bands: potential dynamic support/resistance. Price respecting the upper band hints at bullish momentum; respecting the lower band hints at bearish momentum.
- Midline (baseline): equilibrium. Crosses of the midline can indicate shifts in bias; bounces off the midline often signal continuation.
- Band width: a proxy for volatility. Widening bands suggest a trend/volatility expansion; narrowing bands hint at compression and possible breakout setups.
Trade Setups (EURUSD, M30)
1) Trend Continuation (“Ride the Rail”)
- Context: Bands widening; price closes outside or along the outer band with the midline sloping in the same direction.
- Entry (long example): After a strong bullish candle closes touching/just outside the upper band, enter on a minor pullback that stays above the midline.
- Stop-loss: Below the midline or recent swing low (whichever is tighter but logical).
- Take-profit:
- TP1 near 1R (move stop to breakeven),
- TP2 at 1.8–2.2R or trail behind the lower of (a) the opposite band or (b) a short EMA (e.g., EMA 20).
- Extra filter (optional): RSI(14) > 50 or MACD histogram > 0 for longs; inverse for shorts.
2) Mean Reversion (“Back to Base”)
- Context: Bands relatively flat and not widening; price spikes to an outer band during low-impact periods.
- Entry (short example): Bearish rejection wick at the upper band while the midline is flat. Enter on the close that confirms rejection.
- Stop-loss: A few pips above the rejection high.
- Take-profit: Midline as the initial target; consider partials there and the opposite band if momentum continues.
3) Breakout From Compression
- Context: Bands narrow significantly (squeeze), forming tight ranges.
- Entry: Place a buy stop slightly above the range and a sell stop slightly below it.
- Stop-loss: Opposite side of the range.
- Take-profit: 1.5–2.0× the range height or trail along the outer band once expansion starts.
Risk & Trade Management
- Risk per trade: 0.5%–1% is plenty on M30.
- Max exposure: Avoid stacking more than two correlated positions in the same direction during a single session.
- News filter: Stand aside 15–30 minutes before/after high-impact EUR or USD releases; bands can distort in spikes.
- Trailing logic: In strong trends, a band-based trailing stop (e.g., exit when price closes beyond the opposite band) helps lock in runners.
Backtesting & Optimization Tips
- Sample size: Aim for at least 200–300 trades across multiple weeks (London and NY sessions).
- Walk-forward: Optimize multipliers over one month, then test on the next month without changes to reduce overfitting.
- Session windows: M30 performs differently across Asian vs. London/NY overlaps. Consider a session filter that prioritizes higher liquidity windows.
- Metrics to track: Win rate, average R multiple, maximum drawdown, time-in-trade, and profit factor.
- Robustness check: Small changes (±0.2 ATR multiplier; ±10 EMA period) shouldn’t completely break the edge. If they do, your settings may be overfitted.
Common Mistakes to Avoid
- Chasing every band touch: A touch isn’t a signal by itself; read slope, band width, and candle structure.
- Ignoring regime shifts: Mean reversion rules in ranges; continuation rules in expansions. Don’t mix them up.
- No stop discipline: Bands can and do expand further; use logical stops, not hope.
- Trading through red-flag news: Spreads widen, slippage increases—skip it.
Simple Checklist Before You Click Buy/Sell
- Is the band slope aligned with your trade direction (or flat for mean reversion)?
- Is volatility expanding or compressing—and does your setup match that regime?
- Do you have a clear invalidation (stop) and at least 1.5R target?
- Any upcoming news within 30 minutes? If yes, wait.
- Did you size for ≤1% risk? Good—now you’re thinking like a pro.
Final Thoughts
TARGET BANDS isn’t “magic,” and it doesn’t need to be. On EURUSD M30, it gives you a structured map: trend pressure, equilibrium, and volatility cycles. Combine that with a consistent entry pattern, basic confluence (RSI or MACD is fine), and strict risk rules, and you’ve got a fully testable framework. Start with the suggested settings, keep a journal, and iterate. You’ll quickly see where the tool shines for your style.
Join our Telegram for the latest updates and support

Comments
Leave a Comment