In Forex trading, price movement is driven by one timeless principle: supply and demand. Supply and Demand Indicator V1.0 MT4 is designed to harness this core market logic by identifying high-probability reversal zones where institutional orders have previously caused significant price shifts.
This tool is ideal for traders who want to reduce guesswork and trade with precision. Unlike typical support/resistance indicators, this tool helps you understand where big money is likely to step in again, giving you a strategic advantage in every trade.
✅ What Is the Supply and Demand Indicator?
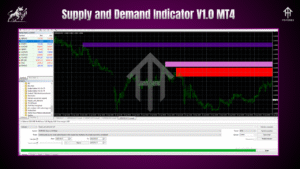
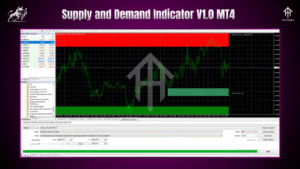
The Supply and Demand Indicator V1.0 is a professional-grade tool built for MetaTrader 4 (MT4) that plots dynamic supply (resistance) and demand (support) zones on your chart. These zones represent areas of institutional order flow—where big players previously caused price to rally or drop sharply.
Each zone is color-coded:
Red for Supply Zones: Where price previously fell from, indicating strong selling.
Blue for Demand Zones: Where price previously rose from, indicating strong buying.
These zones can be used as entry points, stop-loss buffers, or take-profit targets.
???? Key Features
Non-Repainting Zones: Zones remain static after being plotted, allowing traders to trust historical accuracy.
Multi-Timeframe Compatibility: Works across all MT4 timeframes (M1 to MN1).
Auto-Zone Detection: Detects new zones based on real-time price action.
Zone Strength Display: Classifies zones as strong, moderate, or weak based on reaction strength.
Alerts and Notifications: Optional pop-up, sound, and email alerts when price approaches or reacts to zones.
Lightweight and Fast: Minimal impact on MT4 performance.
???? How to Trade Using the Supply and Demand Zones
This indicator is best suited for traders using price action, smart money concepts, or zone-based trading strategies. Here's a simple workflow:
???? Step 1: Wait for a Fresh Zone
Look for a newly formed supply or demand zone on a 15M, 1H, or 4H chart.
???? Step 2: Observe Price Entry
Wait for the price to re-enter the zone. Look for wick rejections, inside bars, or engulfing patterns for entry confirmation.
???? Step 3: Place Entry, SL, and TP
Buy from demand zones with SL slightly below the zone.
Sell from supply zones with SL slightly above the zone.
Take-Profit at the opposite zone or based on R:R of 2:1 or higher.
???? Step 4: Add Confluence
Use trend direction, RSI divergence, or Fibonacci retracements for added confirmation.
???? Best Timeframes and Assets
Timeframes: Works well on M15, H1, H4 for intraday and swing trading.
Currency Pairs: EURUSD, GBPUSD, XAUUSD, USDJPY, GBPJPY, and more.
Other Assets: Also applicable to commodities (Gold, Oil) and indices.
???? Why This Indicator is Better Than Support/Resistance Lines
While support and resistance lines are static and often subjective, supply and demand zones are dynamic, historically validated, and volume-backed. The indicator evaluates not just price levels, but the intensity of prior reactions—giving you a statistically higher chance of success.
???? Use Cases
Scalping with zones on 5M/15M.
Intraday trading using H1 levels.
Swing trading using H4 and D1 zones.
Zone-to-Zone strategy (entry at demand → exit at supply).
⚡ Final Thoughts
Supply and Demand Indicator V1.0 MT4 is a game-changing tool that helps traders follow the footprints of institutional players. If you’re serious about improving your win rate, reducing emotional entries, and mastering price action, this indicator is a must-have.
Whether you're a beginner or a seasoned trader, this tool makes it easy to spot low-risk, high-reward opportunities. Say goodbye to random entries and start trading with real structure and clarity.
Thanks for the visit ...
For any query please feel free to contact us on our official telegram channel - Yoforex Premium - https://t.me/+V6Nr5sRZVr4xYzdl
Comments
Leave a Comment