Introduction
If you’ve been struggling to mark clean supply and demand zones manually on your charts, constantly dragging rectangles and adjusting levels every time the market moves… this indicator is going to feel like a serious upgrade. RNS Supply and Demand Indicator V1.0 MT4 is designed to automatically detect key zones where big players are likely placing orders, helping you trade with structure instead of guessing.
In this guide, we’ll walk through what the indicator does, how it works, how to install it on MetaTrader 4, and some practical tips to use it in real trading. The goal is simple – make your charts cleaner, your entries more logical, and your risk more controlled.
What Is RNS Supply and Demand Indicator V1.0 MT4?
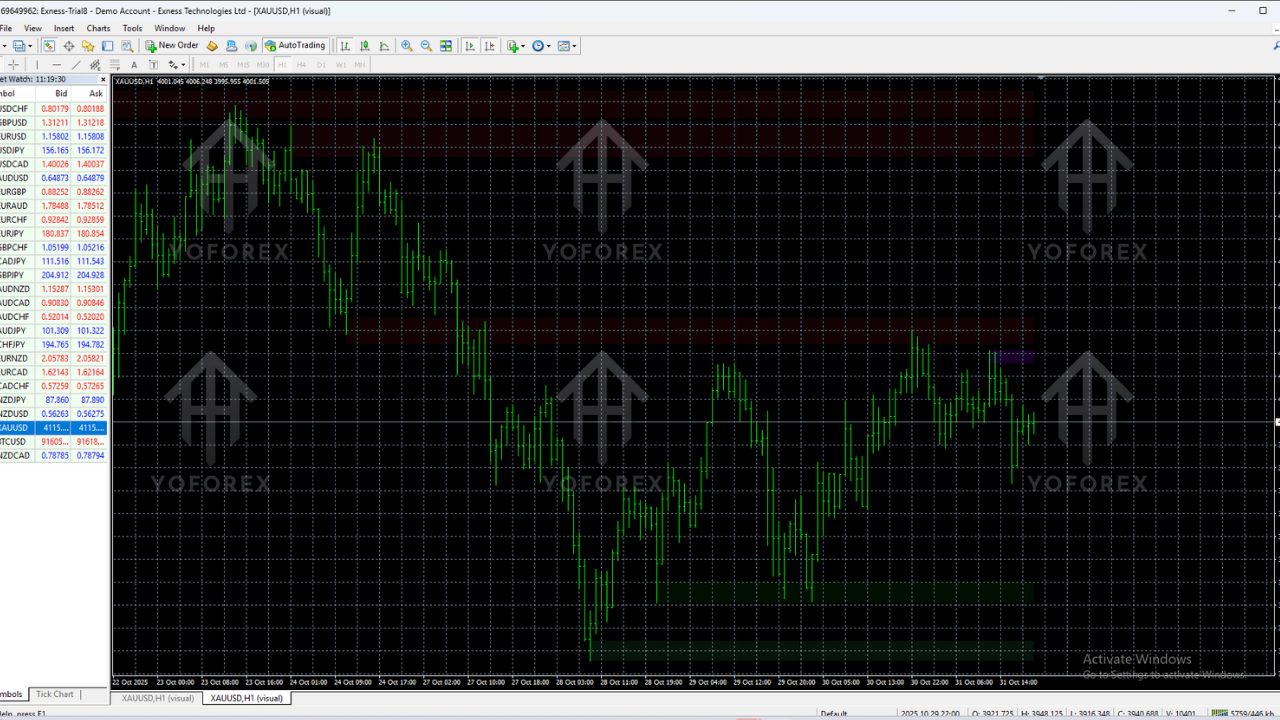
The RNS Supply and Demand Indicator V1.0 is a custom MT4 indicator that automatically plots supply and demand zones on your chart. Instead of drawing every zone by hand, the tool scans recent price action and highlights areas where price has previously reacted strongly – either by dropping aggressively (supply) or rallying sharply (demand).
These zones often represent institutional order blocks, stacked pending orders, or areas where big positions were opened earlier. By trading around these zones, you’re basically aligning yourself with smart money instead of chasing random candles.
Key Benefits at a Glance
- Automatically detects fresh and tested supply and demand zones.
- Helps you find low-risk, high-reward entry points.
- Keeps charts clean and structured instead of messy with random lines.
- Works on multiple pairs and timeframes in MT4.
- Ideal for swing traders, intraday traders, and even scalpers using zone-based setups.
How Does the RNS Supply and Demand Indicator Work?
The indicator scans the market for strong price imbalances – areas where price moved away quickly, leaving behind a zone of unfilled orders. These are usually formed after a big impulsive move, like a strong rally or a sharp drop.
Once detected, the indicator draws colored rectangles to show:
- Supply Zones: Regions where sellers previously dominated and pushed price down.
- Demand Zones: Regions where buyers previously took control and pushed price up.
You can then use these zones as:
- Potential reversal areas.
- Retest regions for continuation trades.
- High-probability zones to set limit orders with predefined stop-loss levels.
Instead of entering in the middle of nowhere, you’re letting the indicator show you “map points” where price is more likely to react again. Of course, nothing is guaranteed in trading, but trading around zones gives you structure and logic, not just vibes.
Core Logic Behind the Zones
- Price Imbalance: Strong candles with little or no pullback mark the beginning of a zone.
- Base + Impulse: The indicator looks for a base (sideways area) followed by a big impulse move away.
- Retests: When price returns to that zone, the level is still considered valid until clearly broken.
That’s basically what many price action traders already do manually, but here it’s automated, consistent and fast.
Key Features of RNS Supply and Demand Indicator V1.0 MT4
- Automatic Zone Detection: No need to manually draw rectangles, the indicator identifies fresh and existing zones for you.
- Multi-Timeframe Support: Use it on M15, H1, H4, or even D1 depending on your trading style.
- Clear Color Coding: Supply and demand zones are visually separated, making it easy to see where buyers and sellers are likely sitting.
- Clean Chart Output: The zones are plotted neatly, so your chart doesn’t look overloaded or confusing.
- Works on All Major Forex Pairs: Especially effective on pairs with good volatility and clean price action.
- Supports Confluence Trading: You can combine zones with trendlines, RSI, MACD, moving averages, or your favorite confirmation tool.
- Helps Define Stop-Loss and Take-Profit: Use zone boundaries to logically place SL/TP instead of guessing pips.
- User-Friendly Parameters: Basic input settings allow you to adjust sensitivity according to your style.
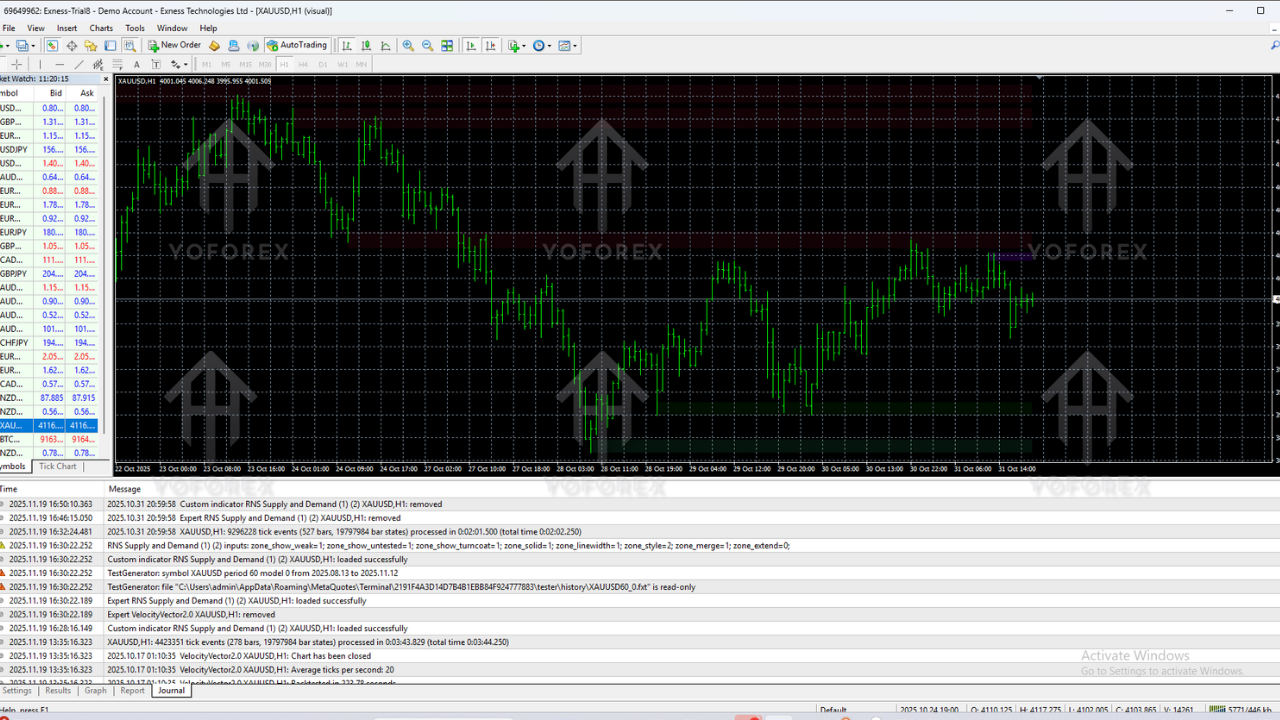
How to Install RNS Supply and Demand Indicator V1.0 on MT4
If you’re new to MT4 custom indicators, don’t worry, the setup process is pretty straightforward. Just follow the steps below.
Step 1: Download the Indicator File
Download the RNS Supply and Demand Indicator V1.0 MT4 file (usually in .ex4 or .mq4 format) from your trusted source and save it somewhere easily accessible on your computer.
Step 2: Open the MT4 Data Folder
In MetaTrader 4:
- Go to File > Open Data Folder.
- In the window that opens, go to MQL4 > Indicators.
Step 3: Copy the Indicator File
Paste the downloaded RNS Supply and Demand Indicator file into the Indicators folder.
Step 4: Restart MetaTrader 4
Close MT4 and open it again. This refreshes the list of indicators and ensures the new one is recognized by the platform.
Step 5: Attach the Indicator to a Chart
Once MT4 is open:
- Go to Navigator (Ctrl+N).
- Expand the Indicators list.
- Find RNS Supply and Demand Indicator.
- Drag and drop it onto your desired chart.
You should now see supply and demand zones plotted automatically over the price chart.
Recommended Settings & Timeframes
The default settings usually work fine for most traders, but you can tweak a few things based on your preference and strategy.
Suggested Timeframes
- Scalpers: M5, M15 (use higher timeframe zones like H1 as main levels).
- Intraday Traders: M15, M30, H1.
- Swing Traders: H4 and D1 for strong, higher-timeframe zones.
A popular approach is to mark zones on H4 or H1 and then drop down to M15 or M5 to look for precise entries with smaller stops.
Zone Sensitivity
Some versions of supply and demand indicators allow you to configure:
- Minimum number of candles in the base.
- Strength of impulse move.
- How many past zones to display.
If your chart looks too crowded, you can reduce the number of zones shown. If it looks too empty, slightly lower the zone strength threshold so more areas are detected.
How to Trade with RNS Supply and Demand Indicator
The indicator itself doesn’t open trades. It’s a tool to help you make better decisions. Here’s a simple, practical way to use it in your strategy.
1. Identify the Trend
First, check the overall market direction:
- Use a moving average (like 50 EMA) or simple price structure (higher highs & higher lows for uptrend; lower highs & lower lows for downtrend).
- Focus on trading in the direction of the main trend; don’t fight the trend just coz a zone appears.
2. Mark Key Zones
Look at higher timeframes (H4, H1) and note the main supply and demand zones. These are your “big levels” where price is more likely to react strongly.
3. Wait for Price to Return to a Zone
Don’t chase every candle. Let price come back to a supply or demand zone. When it does, you can start looking for entries.
4. Use Confirmation
To increase probability, add a confirmation trigger, such as:
- Rejection candles (pin bars, engulfing, etc.).
- Break of minor structure in lower timeframe.
- RSI overbought/oversold lining up with zone.
For example, if price taps a demand zone and forms a bullish engulfing candle on M15, that may be a logical entry for a long with stop-loss below the zone.
5. Place Stop-Loss and Take-Profit
- Stop-Loss: Usually just outside the zone (below for demand, above for supply).
- Take-Profit: Next opposite zone, key structure level, or fixed R:R like 1:2 or 1:3.
The beauty of zone trading is that your stop can be tight compared to your potential reward, coz you’re entering at logical extremes rather than in the middle of a trend.
Tips for Getting the Best Results
- Use fewer, stronger zones: Don’t flood your screen; focus on the cleanest zones with strong moves away.
- Combine with price action: Zones + candlestick patterns + structure is often more powerful than zones alone.
- Respect the higher timeframe: HTF zones usually beat LTF signals, so don’t ignore H4/D1 levels.
- Always manage risk: Never risk more than a small percentage per trade, no matter how strong the zone looks.
- Test before going live: Backtest or run on demo to understand how the indicator behaves in different market conditions.
Pros and Cons of RNS Supply and Demand Indicator
Pros
- Automates a normally time-consuming manual task.
- Encourages structured, zone-based trading instead of impulsive entries.
- Suitable for multiple styles – scalping, intraday, swing.
- Helps define logical stop-loss and take-profit levels.
Cons
- Not a standalone “signal” or “magic” tool – you still need a strategy.
- Too many zones can confuse beginners if they don’t filter correctly.
- No indicator can guarantee 100% accuracy; zones can fail during news and high volatility.
Risk Management & Disclaimer
Even the best supply and demand indicator cannot predict the future. The RNS Supply and Demand Indicator V1.0 MT4 is a powerful tool, but it should be used together with proper risk management and a tested strategy.
Always remember:
- Past performance does not guarantee future results.
- Never trade money you can’t afford to lose.
- Try the indicator on a demo account before going fully live.
Final Thoughts – Is RNS Supply and Demand Indicator Worth Using?
If your trading is already based on price action, zones, and institutional concepts, the RNS Supply and Demand Indicator V1.0 MT4 can save you a lot of charting time and bring more consistency to your analysis. Instead of redrawing rectangles and guessing zone strength, you get a clean visual map of where price previously reacted strongly.
It won’t trade for you and it won’t magically turn every setup into a winner, but as a part of a serious, disciplined approach, it can absolutely upgrade the way you look at charts and plan your entries.
Use it wisely, combine it with confirmations, keep your risk low, and let the zones guide you rather than chasing every random move. That’s where this kind of indicator really shines.
Comments
Leave a Comment