In the fast-paced world of forex and CFD trading, identifying optimal entry and exit points can be the difference between consistent profits and erratic losses. The Overbought Oversold Indicator for MetaTrader 4 (MT4) is designed to pinpoint market extremes—levels where price has moved too far, too fast, and is ripe for a reversal. By automatically calculating momentum oscillations and highlighting zones of overextension, this indicator empowers traders to make informed decisions backed by quantitative analysis. In this guide, we’ll explore the mechanics, features, and practical applications of the Overbought Oversold Indicator MT4, so you can optimize your strategy and trade with greater confidence.
What Is the Overbought Oversold Indicator MT4?
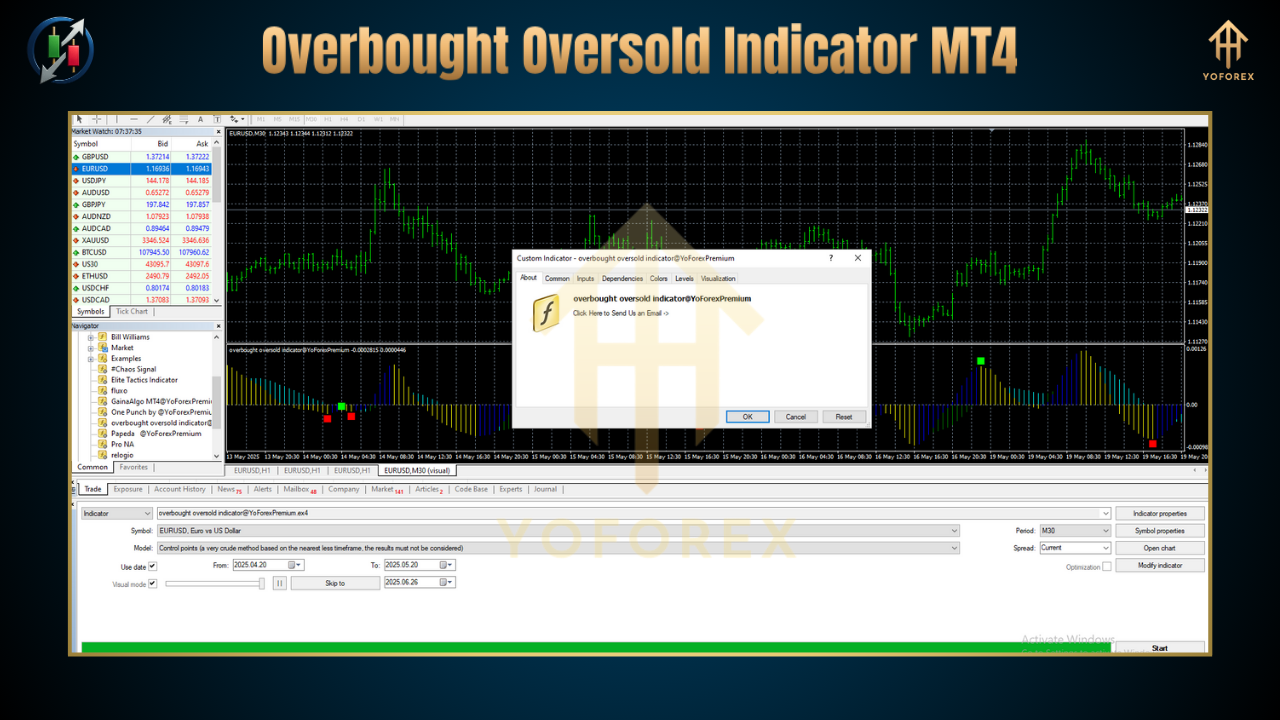
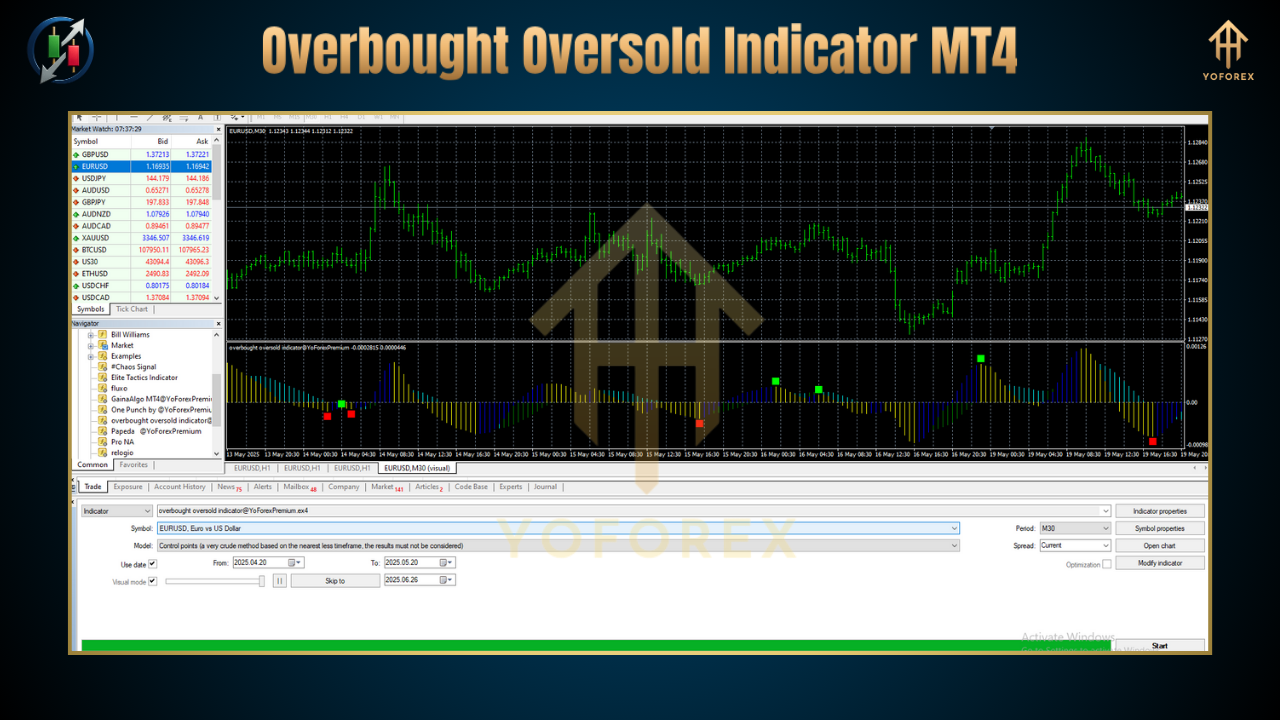
The Overbought Oversold Indicator MT4 is a custom technical tool that measures price momentum and plots two critical horizontal bands on your chart: the overbought zone (usually above a user-defined upper threshold) and the oversold zone (below a lower threshold). When the indicator line (often based on an oscillator like RSI, Stochastic, or a proprietary algorithm) crosses into these zones, it signals that price may be due for a corrective pullback or reversal. Unlike static support and resistance lines, these dynamic bands adjust to volatility, ensuring they remain relevant across different market conditions and timeframes.
How It Works
At its core, the indicator calculates a smoothed momentum oscillator—commonly the Relative Strength Index (RSI) over a specified period (e.g., 14 bars) or a modified Stochastic oscillator. The oscillator value oscillates between 0 and 100:
Overbought zone: values above 70–80 suggest bullish exhaustion.
Oversold zone: values below 20–30 indicate bearish exhaustion.
When the oscillator enters these zones, the indicator colors or highlights the area on your MT4 chart, often with shading or arrows. Some versions also provide configurable alerts (visual, pop-up, or email) when extremes are breached or when the oscillator returns to the neutral band, helping you avoid staring at screens all day.
Key Settings and Customization
Oscillator Type & Period: Choose between RSI, Stochastic, or a combination. Adjust the period to smooth the oscillator—shorter periods (e.g., 7) increase sensitivity but generate more false signals; longer periods (e.g., 21) reduce noise but lag price.
Overbought/Oversold Thresholds: Default levels are 70/30 or 80/20, but you can fine-tune based on asset volatility and timeframe.
Alerts & Notifications: Enable pop-ups, push notifications, or sound alerts when the oscillator crosses thresholds or exits zones.
Visual Customization: Modify line colors, zone shading opacity, and arrow styles to match your chart theme.
By experimenting with these parameters on historical data, you can optimize settings that best capture extremes for your preferred currency pairs or instruments.
Key Features
Dynamic Thresholds: Some advanced versions automatically adjust thresholds based on recent ATR (Average True Range), adapting to changing volatility.
Multi-Timeframe Mode: View overbought/oversold signals from higher timeframes (H4, Daily) directly on your lower-timeframe (M15, H1) chart for context alignment.
Divergence Detection: Highlight hidden or regular divergences between price and the oscillator when price makes new highs/lows but momentum does not.
Integrated Take-Profit & Stop-Loss Recommendations: Calculate suggested profit targets and protective stops based on zone width and ATR multiples.
Alert System: Receive timely alerts to your desktop or mobile when key levels are crossed or when momentum returns to neutral zones.
Benefits of Using the Overbought Oversold Indicator MT4
Objective Extremes: Avoid subjective judgments by relying on quantitative thresholds to mark potential reversal zones.
Improved Timing: Enter trades near true exhaustion levels, enhancing risk-reward ratios and reducing drawdowns.
Visual Clarity: Clearly see overextended moves without cluttering your chart with multiple indicators.
Versatility: Works across asset classes—forex, stocks, commodities, and indices—and on any timeframe.
Complementary: Pairs well with trend-following tools, volume indicators, and price-action strategies.
Practical Application: Trading Pullbacks in an Uptrend
Confirm Uptrend: Ensure price is above a rising moving average (e.g., 50 EMA).
Wait for Oversold Touch: When price retraces and the oscillator dips below the lower threshold (e.g., 30), look for a bullish candlestick pattern (hammer, bullish engulfing) at support.
Enter Long: Place a buy order near the zone exit (oscillator crossing back above 30).
Stop-Loss: Below the recent swing low or fixed ATR multiple (e.g., 1.5 ATR).
Take-Profit: Aim for recent highs or resistance levels, or use a risk-reward ratio (e.g., 1:2).
This pullback strategy allows you to join resilient trends at optimal price points, reducing the chance of entering at overextended highs.
Practical Application: Fade Rallies in a Downtrend
Confirm Downtrend: Price below a falling moving average (e.g., 100 EMA).
Wait for Overbought Signal: Oscillator climbs above 70 or 80 and price nears a trend line or moving average resistance.
Enter Short: After the oscillator turns down and closes back below the threshold.
Stop-Loss: Above recent swing high or set at an ATR-based buffer.
Take-Profit: Target the lower Bollinger Band, recent lows, or a predefined risk-reward ratio.
Fading rallies in a controlled downtrend can capture high-probability reversals when momentum stalls near resistance.
Advanced Tips for Maximum Effectiveness
Combine with Volume Filters: Require a volume contraction in the opposite zone (e.g., low volume on an overbought rally) to validate exhaustion.
Multi-Timeframe Confirmation: Use the indicator on both your trade timeframe (e.g., H1) and a higher timeframe (e.g., H4). Only take signals that align across both charts.
Divergence Alerts: Program the indicator to flag divergences—these often precede major reversals and can yield superior entries.
Time-of-Day Filters: Avoid extreme signals during low-liquidity sessions (e.g., the late U.S. afternoon) when false breakouts and whipsaws are common.
Backtest Rigorously: Run the indicator through at least 100 trades or six months of data on each currency pair to gauge win rate and expectancy before committing real capital.
Risk Management and Money Management
No indicator is foolproof; the Overbought Oversold Indicator MT4 should be one component of a comprehensive trading plan. Always:
Use Proper Position Sizing: Never risk more than 1–2 % of your account on a single trade.
Set Hard Stops: Rely on both chart-based stops and mental stop levels to avoid emotional decision-making.
Monitor Correlation: Be aware of correlated pairs (e.g., EUR/USD and GBP/USD) to avoid doubling risk.
Keep a Trade Journal: Record indicator settings, entry criteria, outcomes, and lessons learned to refine your approach over time.
Conclusion
The Overbought Oversold Indicator MT4 is a powerful tool for identifying market extremes, timing entries and exits, and reinforcing disciplined risk management. By mastering its configuration, combining it with trend and volume analysis, and applying rigorous backtesting, you can harness the indicator’s insights to improve your trading performance across forex, commodities, and indices. Incorporate it into your strategy toolkit—trade smarter, not harder, and let quantified momentum signals guide you toward more consistent profitability.
Thanks for the visit ...
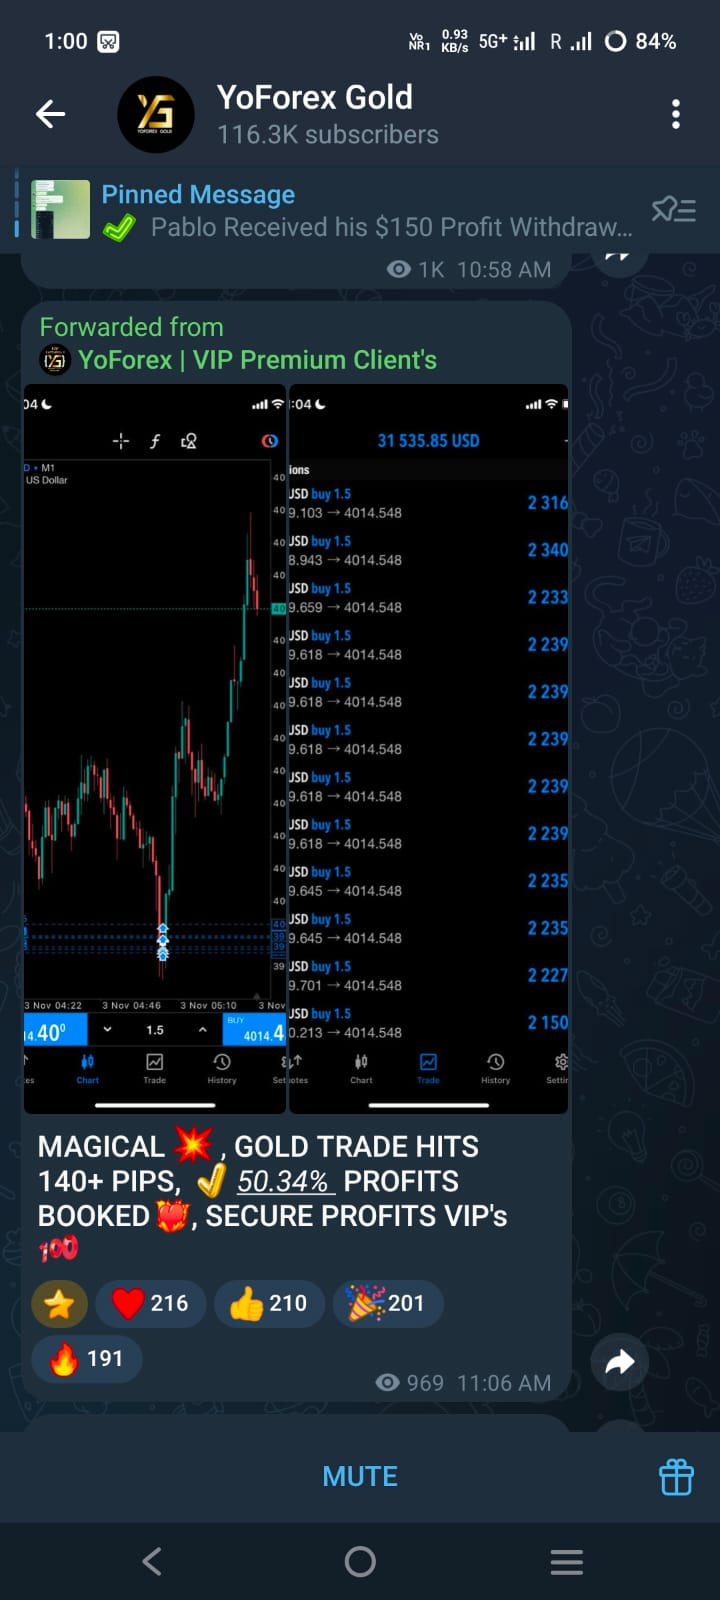
For any query please feel free to contact us on our official telegram channel - Yoforex Premium - https://t.me/+V6Nr5sRZVr4xYzdl
Comments
Leave a Comment