Multi Timeframe Levels Pro Indicator V1.0 MT5 — Precision Market Levels Made Easy
Platform: MT5
Type: Custom Indicator
Markets: Forex, Indices, Commodities, Stocks, Crypto
Trading Styles: Price Action, Swing Trading, Scalping
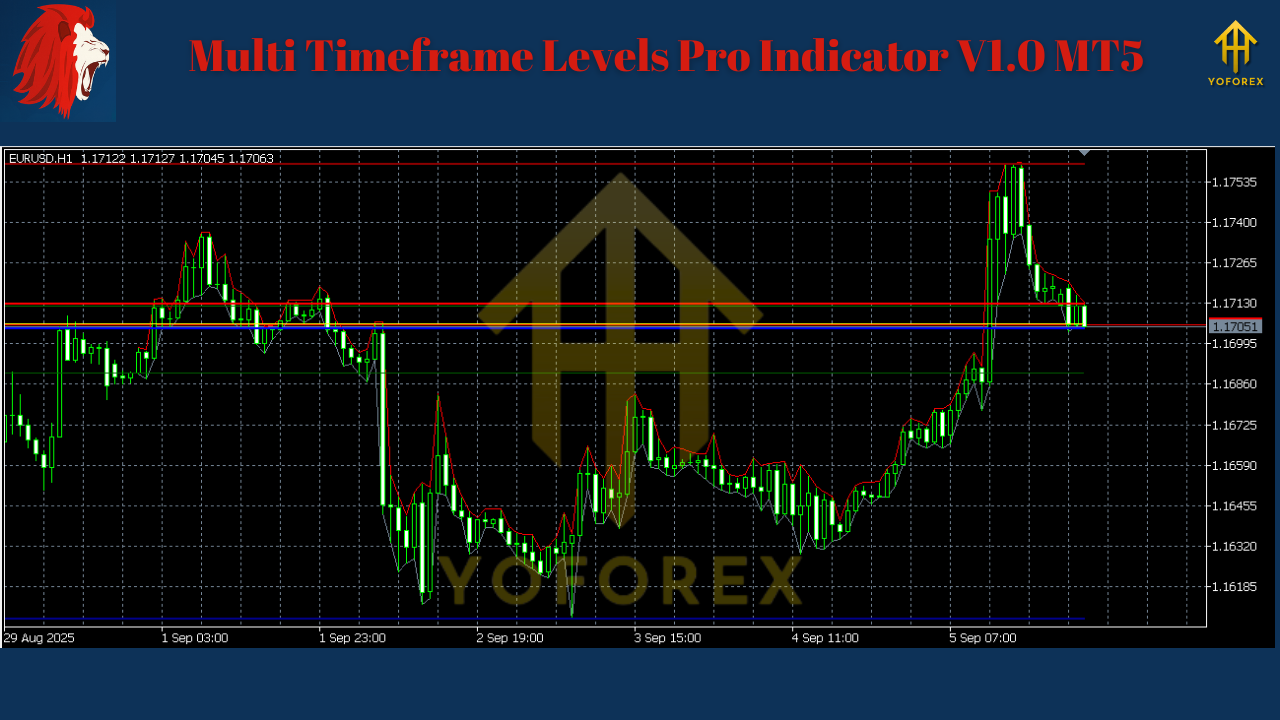
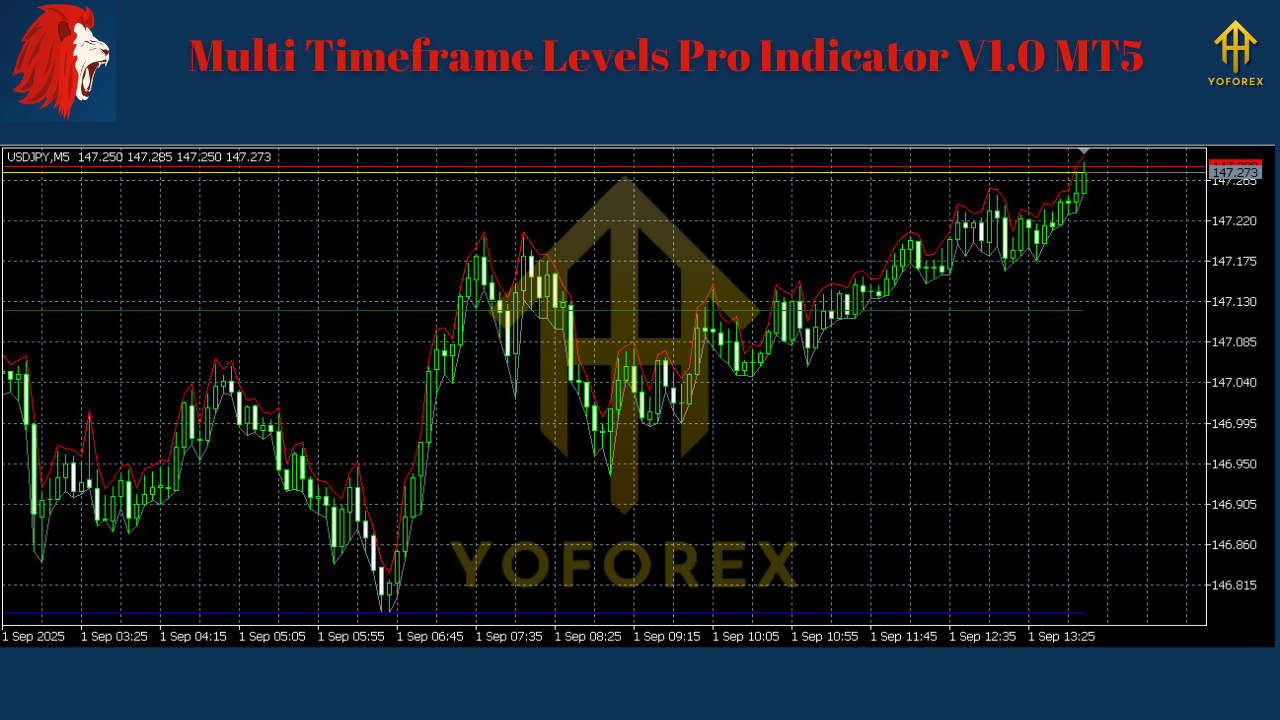
Multi Timeframe Levels Pro Indicator V1.0 is designed for traders who rely on market structure and key levels to make smart decisions. By automatically plotting Daily, Monthly, Quarterly, and Yearly Highs, Lows, Opens, and Closes, it creates a clean map of support, resistance, and breakout zones directly on your chart.
Instead of manually drawing levels or switching between charts, this tool brings everything into a single, clear, and customizable view.
Key Features
- Automatic Multi-Timeframe Levels
Instantly displays Daily, Monthly, Quarterly, and Yearly levels without manual effort. - Color-Coded Clarity
Each level type (High, Low, Open, Close) is assigned unique colors, so you can quickly differentiate them. - Shift Functionality
Analyze previous periods with customizable shift settings (e.g., last month’s high vs. current month). - Universal Market Compatibility
Works on Forex pairs, indices, commodities (Gold, Oil), stocks, and even crypto. - Lightweight & Fast
Designed for efficiency — minimal impact on MT5 performance, even with multiple charts. - Versatile Trading Styles
- Swing traders: Rely on Quarterly and Yearly levels for major zones.
- Intraday & scalpers: Use Daily and Monthly levels for precision entries/exits.
- Breakout traders: Track where price sits relative to historical opens and closes.
Inputs
- DailyShift: Toggle between current and previous daily levels.
- MonthlyShift: View current or past monthly levels.
- QuarterlyShift: Analyze current or previous quarterly levels.
- YearlyShift: Switch between current and historical yearly levels.
Recommended Usage
- Major Zones (Swing & Position Traders):
Rely on Yearly and Quarterly levels as key long-term support and resistance. - Intraday & Scalping:
Use Daily and Monthly levels to identify actionable breakout and reversal points. - Strategy Combo:
- Combine with candlestick patterns for high-probability setups.
- Pair with momentum indicators (RSI, MACD, ADX) for confluence.
- Use as a foundation for breakout or range strategies.
Why Use Multi Timeframe Levels Pro?
- Saves time — no more manual plotting.
- Keeps charts structured and professional.
- Helps spot liquidity pools, fakeouts, and breakout traps.
- Works across all timeframes and all asset classes.
- Perfect for both retail traders and prop firm setups.
Example Workflow
- Attach indicator to XAU/USD (Gold) on M15.
- Plot Daily & Monthly levels → scalp between key intraday zones.
- On higher timeframes (H4, D1), enable Quarterly & Yearly levels → identify where price might stall or reverse.
- Use levels as take profit zones or protective stops.
Pros & Cons
Pros
- Automated plotting saves time.
- Clean and color-coded visualization.
- Works across all markets and styles.
- Backtest-friendly (levels remain consistent historically).
Cons
- Doesn’t generate buy/sell signals — traders must interpret.
- Too many levels enabled at once can clutter charts.
Final Thoughts
The Multi Timeframe Levels Pro Indicator V1.0 MT5 is a must-have tool for traders who rely on price levels. It transforms raw data into an easy-to-read structure, allowing you to trade with confidence and clarity. Whether you’re scalping Gold, swing trading Forex pairs, or mapping out stock levels, this indicator provides a reliable technical backbone for any strategy.
Risk Disclaimer: Indicators are tools, not guarantees. Always combine with sound risk management and confirm setups with other analysis.
Join our Telegram for the latest updates and support


Comments
Leave a Comment