Market Profile DWM Indicator V1.31 MQ4: A Powerful Tool for Forex Traders
The world of forex trading is constantly evolving, with traders always on the lookout for tools that can help them make informed decisions and enhance their trading strategies. One such tool is the Market Profile DWM Indicator V1.31 MQ4, a robust and powerful indicator designed to assist traders in visualizing and analyzing market data more effectively. In this blog post, we will dive deep into what the Market Profile DWM Indicator V1.31 MQ4 is, how it works, its key features, and how traders can benefit from using it.
Introduction to Market Profile DWM Indicator V1.31 MQ4
The Market Profile is a popular charting technique that uses price distribution over time to show how the market has been behaving. It provides a visual representation of the market's activity by showing the most traded price levels, helping traders identify potential support and resistance zones, as well as important market structures.
The Market Profile DWM Indicator V1.31 MQ4 is a custom-built MetaTrader 4 (MT4) indicator that utilizes the concept of market profiling to offer a comprehensive analysis of the market’s price action. It is designed to help traders improve their decision-making process by providing a clear picture of market behavior over different timeframes.
How Market Profile DWM Indicator V1.31 MQ4 Works
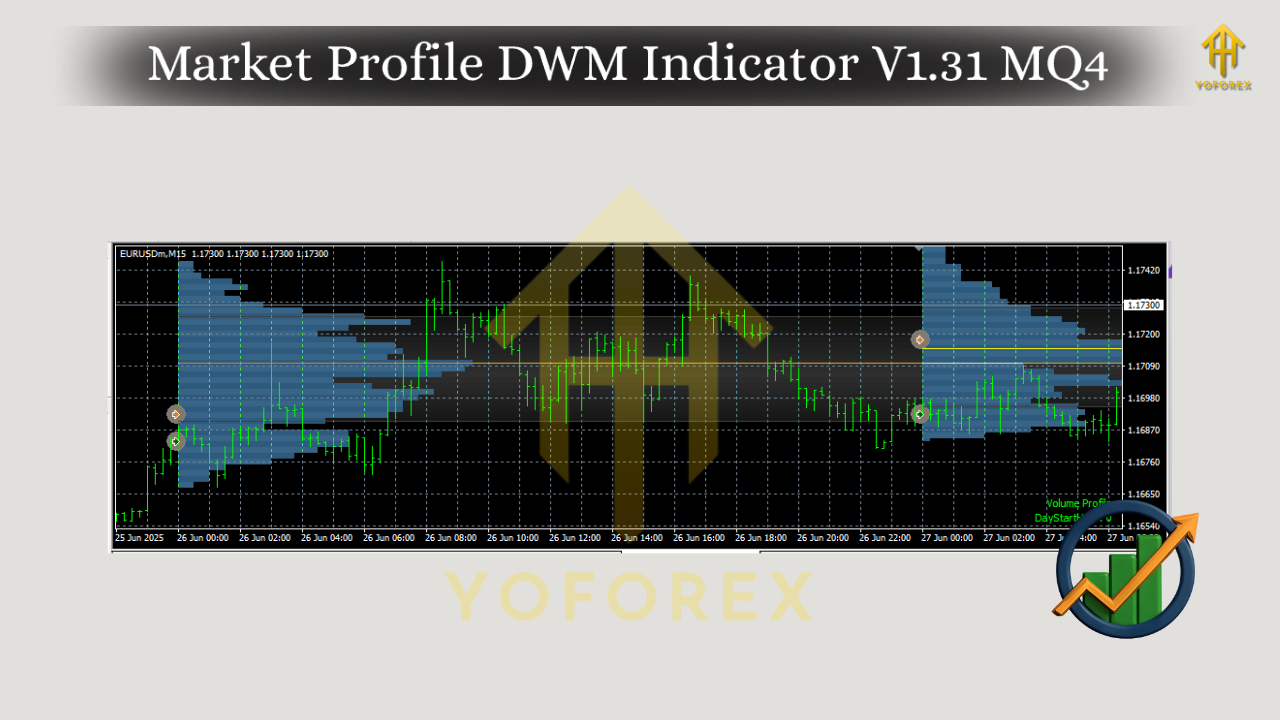
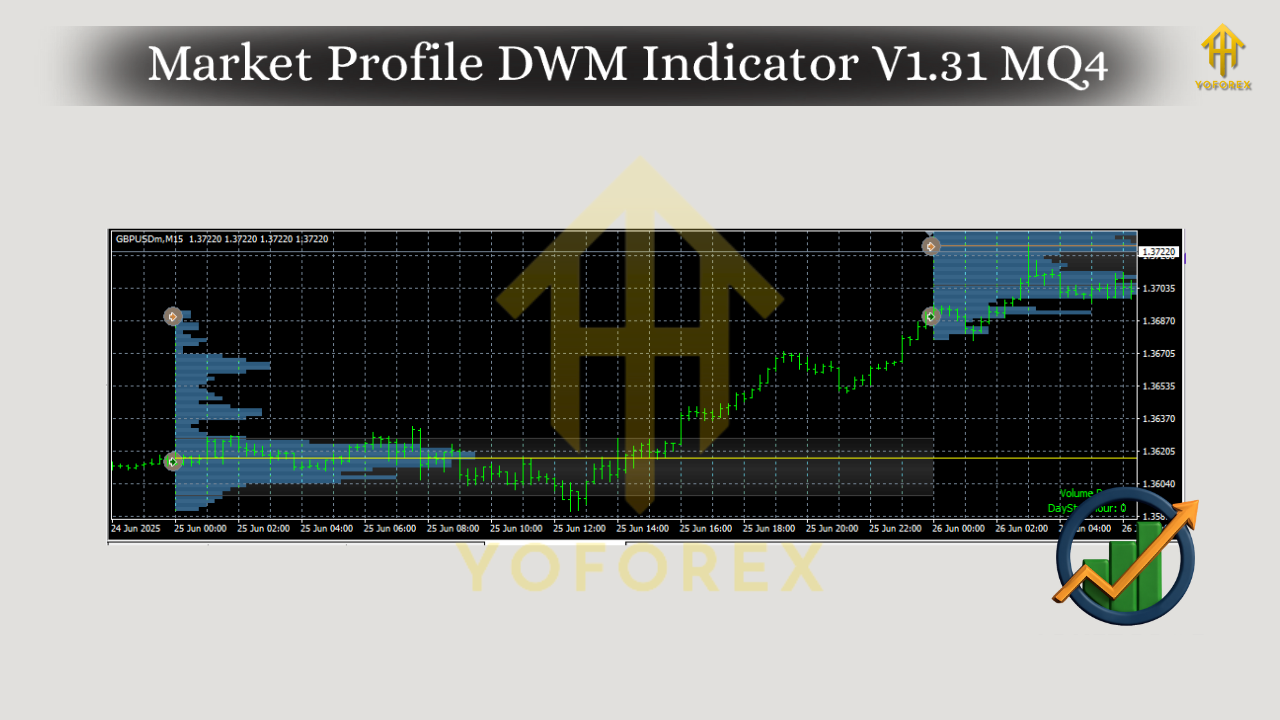
The Market Profile DWM Indicator V1.31 MQ4 uses price data from different timeframes to analyze market trends. The DWM in its name stands for Day, Week, and Month, which indicates that the indicator looks at market data on these three important timeframes to provide traders with insights into market movements.
The indicator helps traders identify key levels of support and resistance, as well as point of control (POC), which is the price level where the most volume has occurred. By visualizing these levels, traders can gain a clearer understanding of the market’s current state and anticipate future price movements.
Key Features of Market Profile DWM Indicator V1.31 MQ4
- Multi-Timeframe Analysis:
The Market Profile DWM Indicator V1.31 MQ4 allows traders to analyze market data across three different timeframes: daily, weekly, and monthly. This feature enables traders to compare price behavior across different time horizons, helping them identify long-term trends and short-term price fluctuations. - Price Distribution Visualization:
The indicator provides a visual representation of price distribution over time, helping traders identify the areas where most of the market's activity has occurred. These areas can act as potential support and resistance zones, making it easier for traders to plan their entries and exits. - Point of Control (POC):
The POC is a crucial concept in market profiling, and the Market Profile DWM Indicator V1.31 MQ4 highlights this level on the chart. The POC represents the price level with the highest trading volume during a specific period. Traders often use this level to gauge market sentiment and anticipate potential price reversals. - Flexible Customization:
The Market Profile DWM Indicator V1.31 MQ4 offers flexibility in customization. Traders can adjust various settings to fit their trading style and preferences, such as the timeframe, color scheme, and the number of periods to consider in the analysis. - Compatibility with MetaTrader 4:
Being an MQ4 file, the Market Profile DWM Indicator is compatible with the MetaTrader 4 platform, which is widely used by forex traders. This ensures that traders can easily integrate the indicator into their existing trading setups without the need for additional software.
Benefits of Using Market Profile DWM Indicator V1.31 MQ4
- Enhanced Market Analysis:
The indicator offers traders a deeper understanding of market activity by visualizing price distribution over time. This enables traders to make more informed decisions based on real market behavior rather than relying on traditional charting methods. - Improved Trade Timing:
By identifying key levels of support, resistance, and the POC, traders can improve their trade timing. The indicator helps traders spot areas where the market is likely to reverse or consolidate, providing better entry and exit points. - Adaptability:
The Market Profile DWM Indicator V1.31 MQ4 is versatile and can be used in various market conditions. Whether a trader is scalping on lower timeframes or holding positions over a longer period, the indicator adapts to different trading styles. - Increased Confidence:
The clear visualization of key market levels boosts a trader’s confidence in their trades. By seeing the market’s behavior across different timeframes, traders can have a better grasp of the current market sentiment and make decisions with more certainty. - Better Risk Management:
By identifying support and resistance levels, the Market Profile DWM Indicator V1.31 MQ4 allows traders to set better stop-loss and take-profit orders. This helps reduce the risk of large losses and increases the chances of profitable trades.
How to Use Market Profile DWM Indicator V1.31 MQ4
To use the Market Profile DWM Indicator V1.31 MQ4, follow these simple steps:
- Install the Indicator:
Download the MQ4 file and place it in the Indicators folder of your MetaTrader 4 platform. Once installed, restart the platform to load the indicator. - Apply the Indicator to Your Chart:
Open the chart of the currency pair or asset you want to analyze, and apply the Market Profile DWM Indicator from the Navigator window. You can adjust the settings to suit your preferences. - Interpret the Data:
Once the indicator is applied, the chart will display the market profile, highlighting key levels such as the POC, support, and resistance zones. Use these levels to identify potential trade opportunities. - Monitor the Market:
Continuously monitor the market profile as price action unfolds. Use the indicator’s data to adjust your trading strategy as needed and make real-time decisions based on market conditions.
Conclusion
The Market Profile DWM Indicator V1.31 MQ4 is a powerful tool for traders who want to enhance their market analysis and improve their trading decisions. By providing a detailed visualization of market activity across different timeframes, the indicator helps traders identify key support and resistance levels, understand market sentiment, and manage their trades more effectively.
Whether you're a beginner or an experienced trader, incorporating the Market Profile DWM Indicator V1.31 MQ4 into your trading strategy can offer significant advantages. So, why wait? Start using this powerful tool today and take your forex trading to the next level!


Comments
555
555
555
555
555
555
555
555
555
555
555
555
555
555
555
555
555
555
555
555
555
555
555
555
555
555
555
555
555
555
555
555
555
555
555
555
555
555
555
555
555
555
555
555
555
555
555
555
555
555
555
555
555
555
555
555
@@Ja6SC
555????%2527%2522\'\"
555
555'"
555'||DBMS_PIPE.RECEIVE_MESSAGE(CHR(98)||CHR(98)||CHR(98),15)||'
555*DBMS_PIPE.RECEIVE_MESSAGE(CHR(99)||CHR(99)||CHR(99),15)
555jly2NJWF')) OR 390=(SELECT 390 FROM PG_SLEEP(15))--
555hwGLyZdJ') OR 825=(SELECT 825 FROM PG_SLEEP(15))--
555iQUS58C8' OR 315=(SELECT 315 FROM PG_SLEEP(15))--
555-1)) OR 947=(SELECT 947 FROM PG_SLEEP(15))--
555-1) OR 628=(SELECT 628 FROM PG_SLEEP(15))--
555-1 OR 893=(SELECT 893 FROM PG_SLEEP(15))--
555plmE20Ro'; waitfor delay '0:0:15' --
555-1 waitfor delay '0:0:15' --
555-1); waitfor delay '0:0:15' --
555-1; waitfor delay '0:0:15' --
(select(0)from(select(sleep(15)))v)/*'+(select(0)from(select(sleep(15)))v)+'"+(select(0)from(select(sleep(15)))v)+"*/
5550"XOR(555*if(now()=sysdate(),sleep(15),0))XOR"Z
5550'XOR(555*if(now()=sysdate(),sleep(15),0))XOR'Z
555*if(now()=sysdate(),sleep(15),0)
-1" OR 2+600-600-1=0+0+0+1 --
-1' OR 2+770-770-1=0+0+0+1 --
-1' OR 2+254-254-1=0+0+0+1 or 'LpTi5qmq'='
-1 OR 2+59-59-1=0+0+0+1 --
-1 OR 2+659-659-1=0+0+0+1
555
555
555
Leave a Comment