Market Balance Indicator V1.0 MT4 – A Deep Dive Into Buyer–Seller Strength Analysis
If you’ve ever stared at your MT4 chart and felt confused about who’s actually in control—buyers or sellers—then the Market Balance Indicator V1.0 MT4 is going to feel like a breath of fresh air. Many traders rely only on candlestick patterns or price action, but the real game-changer is understanding the underlying pressure that moves the charts… the actual market imbalance. And honestly, most retail indicators don’t do that properly.
This new Market Balance Indicator for MetaTrader 4 tries to fix that. Designed to give clarity instead of more noise, it analyzes the behavior of both sides of the market in real-time. From order flow shifts to volume surges to micro-momentum spikes, it tries to act like an X-ray beneath the price chart. Slightly feels like having insider clarity, tho not literally of course.
Below, we’ll break down everything you need to know about this tool—how it works, why so many scalpers are using it, timeframe suggestions, how to interpret signals, and whether it truly helps reduce false entries.
Let’s jump in…
What Is the Market Balance Indicator V1.0 MT4?
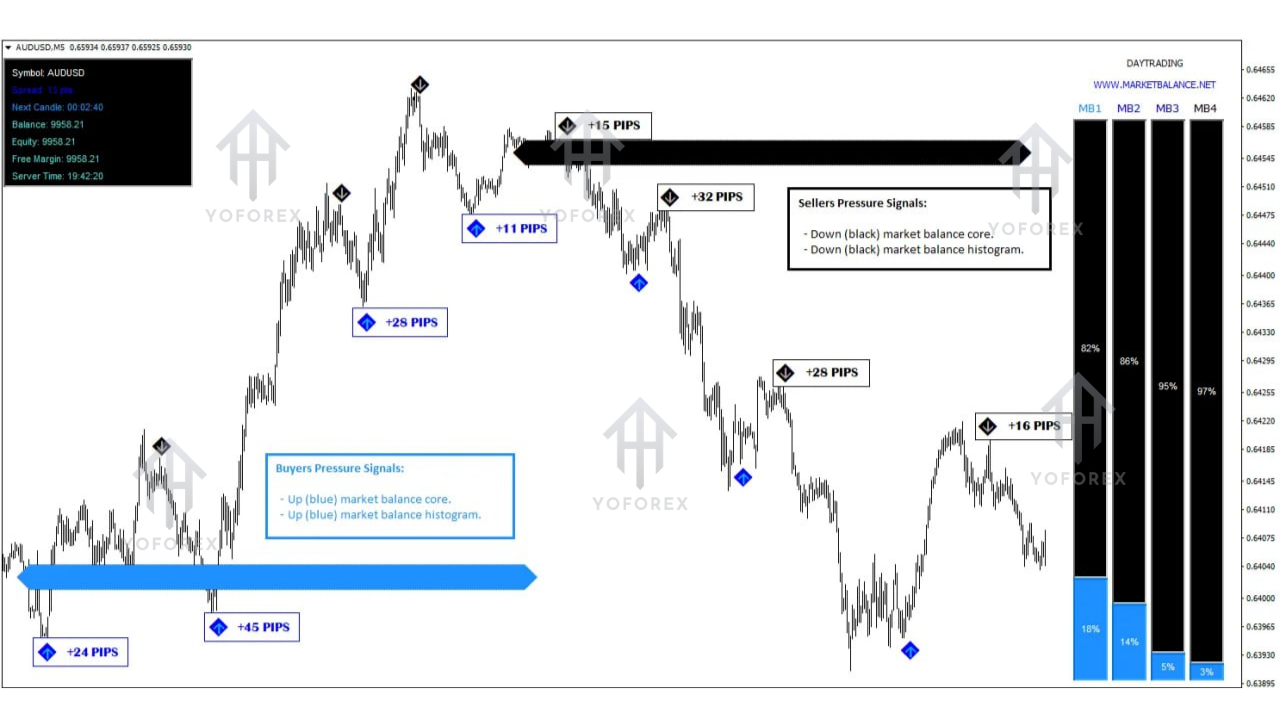
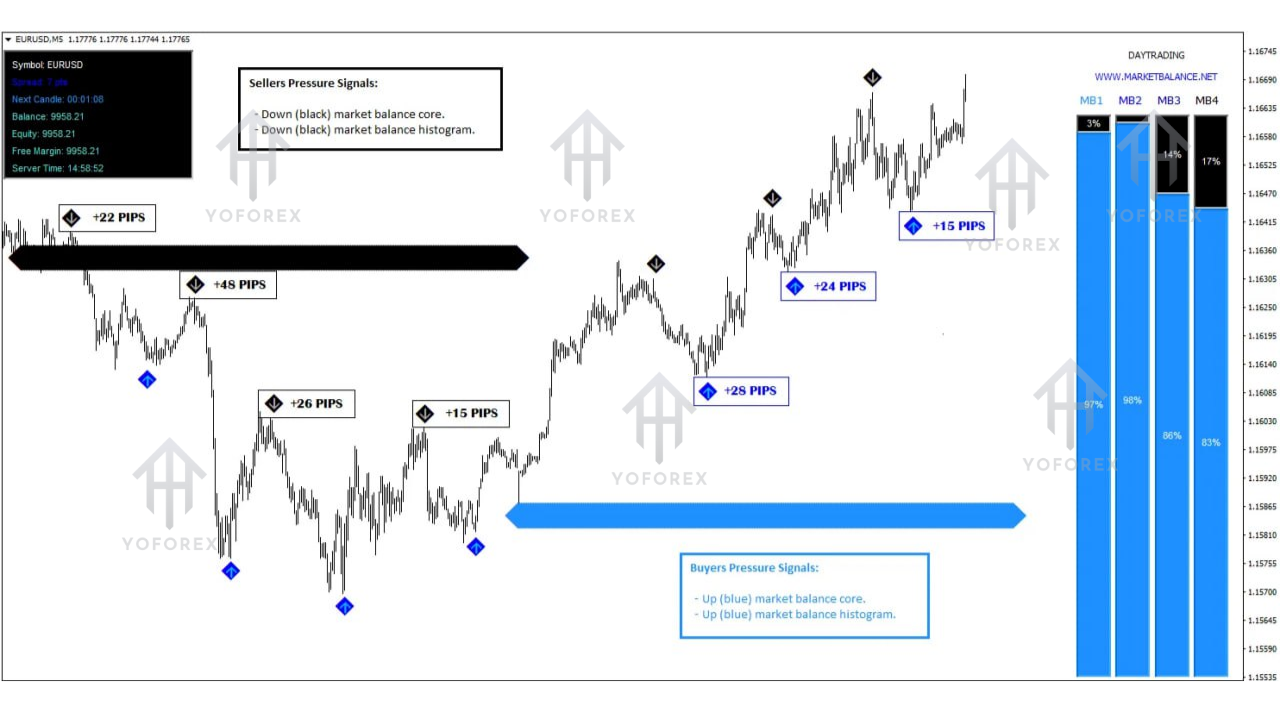
In simple terms, the Market Balance Indicator shows you the real-time battle between buyers vs. sellers. Instead of waiting for candles to close or lagging indicators like RSI or MACD to catch up, this tool measures the current pressure in the market as it’s happening.
Here’s how it works behind the scenes:
- It studies order-flow tendencies (not real order flow, but the simulated version from tick activity).
- It monitors volume impulses to detect aggressive buyers or sellers.
- It evaluates momentum flow to understand short-term strength bursts.
- It identifies when the market is in imbalance (one side dominating).
- It marks areas where equilibrium is forming (possible reversal zones).
This combination creates a clean, visually simplified model of market control—very useful for scalpers and intraday traders.
The Market Balance Indicator was specifically optimized for M1, M5, and M15 timeframes. That means:
- M1 = ultra-fast scalpers.
- M5 = low-risk intraday traders.
- M15 = swing scalpers and breakout traders.
If you trade lower timeframes, this tool fits perfectly.
Why Market Balance Matters More Than Standard Indicators
Traditional indicators—RSI, MACD, Bollinger Bands—are all calculated based on price, which is always lagging. That’s why sometimes you get late signals or false breakouts.
Market balance gives a different picture:
- When buyers are taking over, the indicator shows surging buying pressure.
- When sellers dominate, it reveals consistent downward weight.
- When both are equal, it indicates neutrality, warning you to avoid entries.
Think of it like this:
Candles show “what happened.”
Market balance shows “what’s happening now.”
This difference alone can help reduce bad trades.
Key Features of Market Balance Indicator V1.0 MT4
Below are the standout features traders love:
- Real-time buyer vs. seller pressure tracking
- Detects market imbalance instantly
- Highlights equilibrium zones (great for reversals)
- Monitors volume activity & impulse strength
- Reduces false signals by filtering fake momentum
- Optimized for scalpers (M1, M5, M15)
- Works on any MT4 broker chart
- Non-repainting signals
- Perfect for breakout and reversal traders
- Lightweight & fast processing
- Easy-to-understand color-coded display
This indicator doesn’t spam signals. Instead, it shows the underlying imbalance—letting YOU decide the best entry.
How the Indicator Helps in Real Market Conditions
Let’s break this down with practical examples.
1. During Breakouts
Breakouts often fake out traders, especially in London and NY session volatility.
This tool prevents that by showing:
- If buyers are genuinely strong
- Or if sellers are absorbing orders from above
If sellers dominate during a supposed bullish breakout, the indicator shows imbalance… you avoid a losing trade.
2. During Reversals
Market reversals come with early warning signs:
- Losing momentum
- Weakening volume
- Pressure shifting from one side to the other
This indicator translates these clues clearly so you don’t enter too early (or too late).
3. During Ranging Markets
Ranging phases are dangerous for beginners. But equilibrium zones show:
- No side holds real dominance
- Better to stay out
- Wait for a clean momentum push
This reduces random, emotional entries.
4. High-Volatility News Moments
News candles look big but often reverse. The indicator quickly shows whether the movement is backed by real pressure or just a news spike with no strength.
Who Should Use This Indicator?
The indicator is ideal for:
Scalpers
Intraday traders
Trend-followers
Breakout traders
Reversal hunters
Anyone using lower timeframes
Traders tired of repainting indicators
Technical analysts who prefer raw strength analysis
If you love clean market structure trading, this fits your style.
Best Timeframes & Pairs
Timeframes Supported:
- M1
- M5
- M15
Works on All Pairs:
- Forex majors
- Forex minors
- Gold (XAUUSD)
- Indices
- Crypto (MT4 brokers)
But traders report the best stability on:
- EURUSD
- GBPUSD
- USDJPY
- XAUUSD
Those pairs have strong liquidity, so pressure data becomes clearer.
How to Use the Signals – A Simple Guide
Here’s a simple interpretation flow:
Strong Buyer Pressure (Green Zone or High Reading)
→ Look for buy entries
→ Best with breakouts, pullback entries
Strong Seller Pressure (Red Zone)
→ Look for sell entries
→ Good for trend-following
Neutral / Flat Readings
→ Avoid trading
→ Market is indecisive
Sudden Pressure Shift
→ Great for reversal trades
→ Works well near support/resistance
Traders usually combine this indicator with:
- Simple moving averages
- Support/resistance levels
- Trendlines
- VWAP (optional)
Benefits of Using Market Balance Indicator
- Clear decision-making
- Helps avoid fake breakouts
- Reduces emotional trading
- Perfect for scalpers who hate lag
- Identifies early trend shifts
- Works even for beginners
- Shows the “why” behind market moves
This makes your trading more structured and logical.
Installation Guide for MT4
- Download the Market Balance Indicator (EX4 file).
- Open MT4 → Click File → Open Data Folder.
- Go to MQL4 → Indicators.
- Paste the EX4 file.
- Restart MT4.
- Open a chart → Insert → Indicators → Custom → Market Balance Indicator.
It loads instantly and displays real-time pressure.
Final Verdict – Is Market Balance Indicator Worth It?
Yes—especially if you're a scalper or intraday trader. Most indicators don’t reveal what's happening inside the market. This one does. It’s not magic, but it gives clarity. And clarity reduces losses.
If you want to trade with confidence, filter out false setups, and understand the real battle happening behind every candlestick… this tool is absolutely worth having in your MT4 toolkit.
Comments
Leave a Comment