Introduction
If you’ve ever stared at the chart wondering who’s really in control – buyers or sellers – you’re honestly not alone. Price goes up, down, fakes out, and most traders are just reacting. The Buyers vs Sellers Indicator V1.0 MT4 is designed to solve that exact confusion by showing the real-time strength of buying and selling pressure in a simple, visual way.
Instead of guessing based on candle shapes alone, this indicator shows you who’s dominating behind the scenes. It tracks market pressure, volume and momentum to help you avoid bad entries and emotional decisions. If you’re tired of getting trapped in fake moves, this tool can help you see what’s really happening under the hood.
In this full guide, we’ll walk through what the indicator is, how it works, how to trade with it, how to install it on MT4, and why it can become a core part of your trading toolkit.
What Is the Buyers vs Sellers Indicator V1.0 MT4?
The Buyers vs Sellers Indicator V1.0 MT4 is a custom MetaTrader 4 indicator that measures and displays the balance between buying and selling pressure in the market. Instead of just relying on price movement or basic indicators, it translates tick volume and directional movement into a clear visual representation.
In simple words, it helps you answer these questions:
- Are buyers currently stronger than sellers?
- Is the bullish move strong or just a weak spike?
- Are sellers quietly gaining control in the background?
- Is the market trending with power, or just ranging and choppy?
- Is a potential reversal building up in terms of pressure?
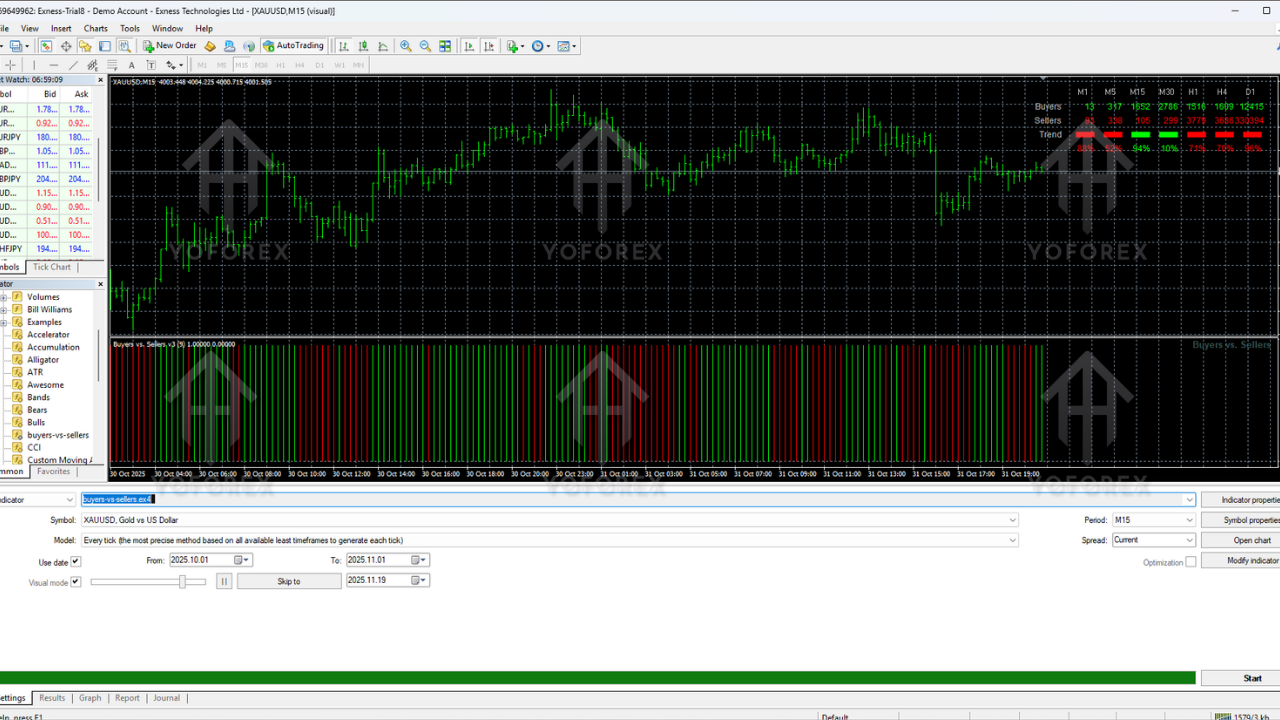
The indicator usually displays a colored histogram or bar-style output that changes based on who is dominating – buyers or sellers. This gives you instant insight into real-time sentiment, rather than relying on delayed or lagging tools.
Why Market Pressure Matters More Than Just Price
Price alone can be very misleading. A candle may look strong, but without volume and pressure behind it, the move can die quickly. That’s why professional traders care more about order flow and volume imbalance than just “green candle vs red candle”.
The Buyers vs Sellers Indicator V1.0 MT4 focuses on:
- Who is pushing harder? Buyers or sellers?
- Is momentum rising or fading?
- Is the move sustainable? Or just a short squeeze/liquidity grab?
When you combine price action with market pressure data, your entries become more selective, your stop-losses make more sense, and your overall confidence improves. It doesn’t magically remove risk, but it cuts down a lot of the blind guessing that many traders do daily.
Key Features of Buyers vs Sellers Indicator V1.0 MT4
Here are the main features that make this indicator useful for both beginners and advanced traders:
- Real-Time Market Pressure Measurement – See instantly who is in control: buyers or sellers.
- Visual Histogram Display – Colored bars help you quickly understand shifts in strength without overthinking.
- Trend Continuation & Reversal Clues – Detect when an existing trend is getting stronger or losing power.
- Multi-Timeframe Compatibility – Use it on M1, M5, M15, H1, H4, or even D1 for scalping, intraday, or swing trading.
- No Repainting After Candle Close – Once a bar closes, the indicator doesn’t change history, which is great for backtesting.
- Works on All Major Forex Pairs – EURUSD, GBPUSD, XAUUSD, USDJPY and more can all be analyzed.
- Easy to Read and Beginner-Friendly – You don’t need to be a quant or coding expert to understand it.
- Supports Smart Money & Volume-Based Approaches – Pairs really well with SMC, order flow and liquidity concepts.
How the Buyers vs Sellers Indicator Works
Under the hood, the indicator analyses:
- Tick volume – Approximate number of price changes in a candle.
- Candle direction and size – Whether the candle is bullish or bearish.
- Market imbalance – Whether buying or selling pressure is stronger.
It then converts this info into a visual output. Typically, you will see:
- Green/blue bars when buyers are stronger.
- Red/orange bars when sellers are stronger.
- Small or neutral bars when neither side has clear control (range or low volatility).
This means you can glance at the indicator and immediately get a sense of who’s dominating, instead of manually trying to interpret dozens of candles.
How to Use the Indicator for Buy Trades
1. Look for Buyer Dominance
Before thinking of buying, check that buyer strength bars are clearly increasing. You want to see buyers gradually overpowering sellers, not the other way round.
2. Confirm With Price Structure
Ideally, price should be forming higher highs and higher lows. If the indicator shows buyer dominance while price breaks above a recent resistance level, that’s a much stronger setup.
3. Avoid Choppy Zones
If both buyer and seller strengths keep flipping rapidly, the market is probably ranging or news-driven. It’s better not to force trades in this kind of mess.
4. Example Buy Setup
You see buyers at around 65–70% strength, seller bars shrinking, and price breaking above a previous swing high. You could:
- Enter a buy on a minor pullback.
- Place stop-loss below recent structure low.
- Target the next resistance or a fixed R:R like 1:2 or 1:3.
How to Use the Indicator for Sell Trades
1. Confirm Seller Dominance
Look for a clear rise in seller strength and a decline in buyer bars. When sellers consistently overpower buyers, the bearish move is more likely to sustain.
2. Align with Downtrend Structure
Check if price is forming lower highs and lower lows. If yes, and sellers are strong on the indicator, you’re trading with both trend and pressure on your side.
3. Watch for Pullback Entries
Instead of chasing the move at the bottom, wait for pullbacks into resistance or supply zones while seller strength remains dominant.
4. Example Sell Setup
Sellers hold around 60%+ of the pressure, buyers are weakening, and price breaks below a key support level. You could:
- Enter a sell after a small pullback to broken support (now resistance).
- Keep stop-loss above the recent swing high.
- Target the next demand area or use risk-reward based exits.
Using the Indicator for Reversal Detection
Reversals are where many traders either make big profits or blow accounts. The Buyers vs Sellers Indicator V1.0 MT4 helps by showing early shifts in strength.
You might notice:
- Buyer strength gradually dropping even though price is still rising.
- Seller bars increasing from very low levels near a major resistance zone.
- Pressure flipping from buyer-dominant to seller-dominant or vice versa.
When you combine these clues with:
- Support and resistance levels,
- Trendlines,
- Liquidity zones or wick rejections,
you can often catch reversals earlier than traders who look only at the candles.
Scalping with Buyers vs Sellers Indicator V1.0 MT4
Scalpers need fast and clear info, coz trades are usually open for just a few minutes. This indicator can be very handy for M1–M5 charts when used correctly.
A simple scalping approach might look like this:
- Use M5 or M1 as your entry timeframe.
- Only trade when either buyers or sellers are strongly dominant.
- Avoid taking trades in extremely low volume or during random spikes.
- Target small but consistent profits (5–15 pips depending on pair and spread).
Pairs like EURUSD, GBPUSD and XAUUSD are commonly used due to good volatility and lower spreads with decent brokers.
Intraday & Swing Trading with the Indicator
For intraday traders, you can combine higher and lower timeframes:
- Use H1 to identify the main direction (uptrend or downtrend).
- Drop down to M15 or M30 to time entries using the indicator’s strength readings.
- Enter trades only when the indicator aligns with the higher timeframe bias.
For swing trading (H4 or D1), the indicator helps you:
- Filter out weak trends that don’t have strong backing.
- Avoid chasing candles that look big but have low real pressure.
- Spot gradual shifts from buyer to seller dominance around major levels.
It won’t turn every trade into a winner, but it does help you avoid many low-quality setups.
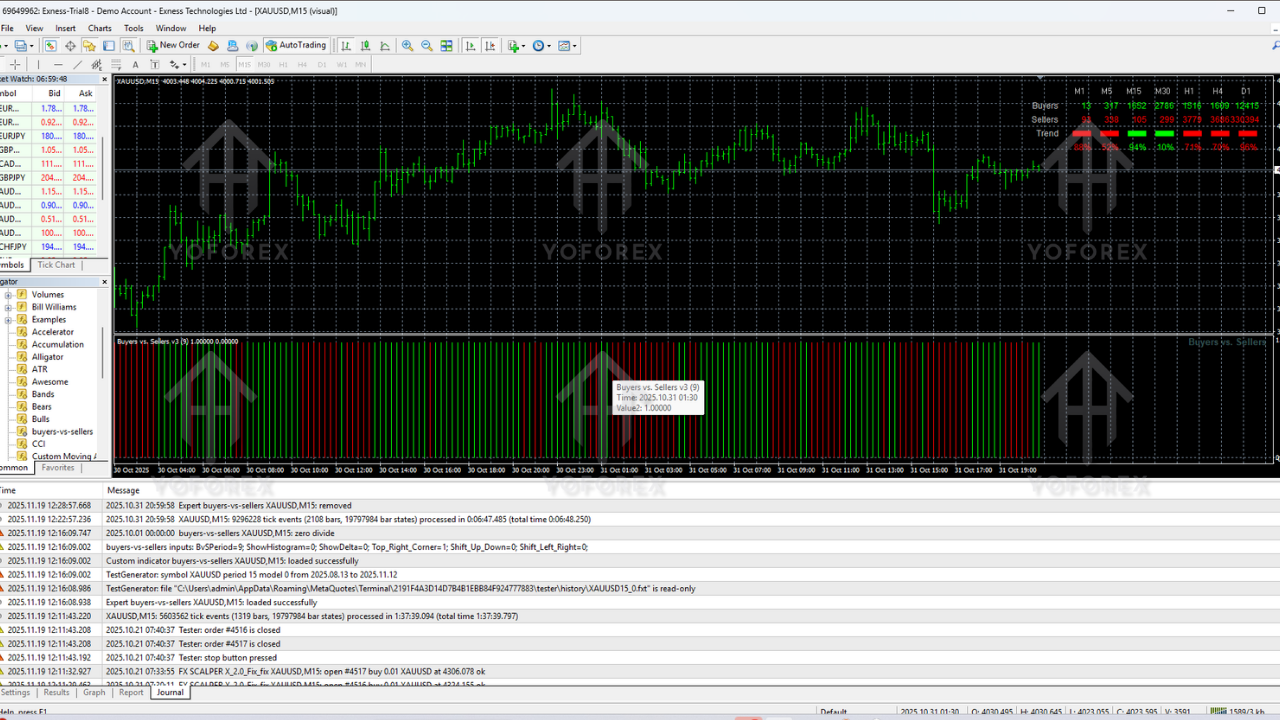
Backtesting & Performance Overview (Short Human Summary)
Backtesting the Buyers vs Sellers Indicator V1.0 MT4 across major pairs shows some consistent patterns:
- When combined with trend direction and structure, entry quality improves a lot.
- False breakouts are easier to spot when the indicator doesn’t confirm the breakout pressure.
- Reversal hints appear a few candles before bigger moves in many cases.
- Win rates tend to improve when traders focus only on strong imbalance signals instead of trading every small fluctuation.
Of course, it’s not a magic bullet. It’s a tool that becomes powerful when used with discipline, risk management, and a well-defined trading plan.
How to Install Buyers vs Sellers Indicator V1.0 on MT4
Installation is simple. Just follow these steps:
- Download the indicator file (.ex4 format).
- Open your MetaTrader 4 platform.
- Click on File > Open Data Folder.
- Go to MQL4 > Indicators.
- Paste the indicator file into this folder.
- Close and reopen MT4 (or refresh the Navigator window).
- In the Navigator panel, find the indicator and drag it onto your chart.
Within a moment, you’ll see the buyers vs sellers strength appear on your chart as visual bars or histograms.
Recommended Settings & Customization
The default settings are usually enough for most traders, but you can customize:
- Sensitivity – Higher sensitivity for scalping, lower for swing trading.
- Colors – Adjust to match your chart theme for easier visibility.
- Alert settings – Enable alerts for strong shifts in dominance if supported.
The idea is to keep it clean and easy to read. Overcomplicating settings can create confusion instead of clarity.
Support & Risk Disclaimer
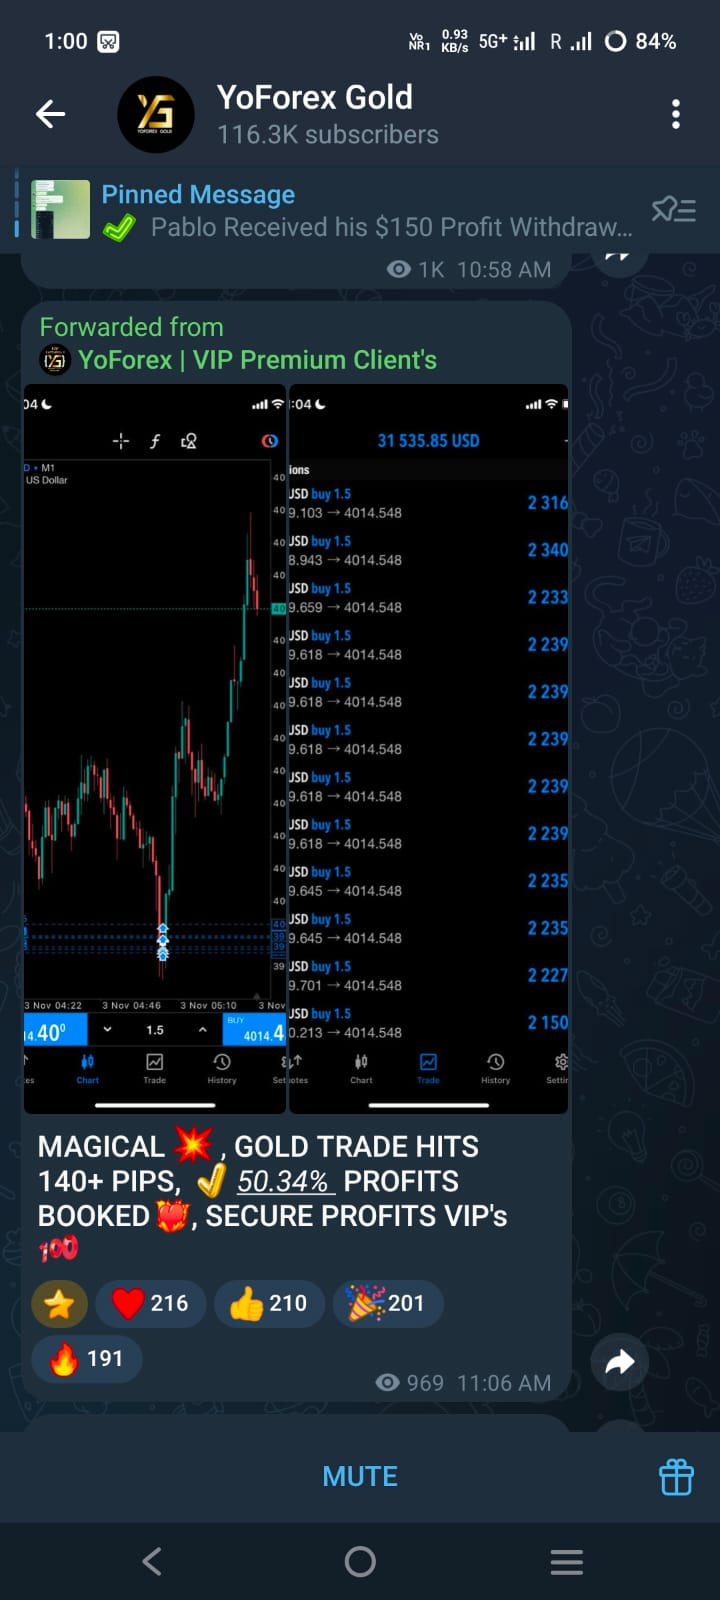
If you face issues with installation, settings, or usage, you can always reach out for help and trading community interaction:
WhatsApp Support: https://wa.me/+443300272265
Telegram Group: https://t.me/yoforexrobot
Disclaimer: Forex trading involves significant risk and may not be suitable for all traders. The Buyers vs Sellers Indicator V1.0 MT4 is a tool to help improve decision-making, but it cannot guarantee profits. Always backtest, use a demo account first, and risk only capital you can afford to lose. Use proper stop-losses, risk management and avoid over-leveraging.
Final Thoughts – Is Buyers vs Sellers Indicator V1.0 MT4 Worth Using?
If you’re tired of random guessing and want to actually “see” who’s in control – buyers or sellers – then yes, this indicator can be a game changer in your trading journey. It doesn’t remove risk, but it adds clarity, and clarity is something most traders desperately need.
By combining this tool with price action, structure, and sensible risk management, you can create a more robust trading plan. Whether you scalp, day trade, or swing trade, understanding market pressure gives you an edge that pure candlestick reading often can’t.
If you want to upgrade your chart from just candles to proper market strength analysis, the Buyers vs Sellers Indicator V1.0 MT4 is a strong place to start.
Comments
Leave a Comment