RSI OMA Indicator MT5 – The Ultimate Guide for Traders
The RSI OMA Indicator MT5 is a powerful tool that enhances the traditional Relative Strength Index (RSI) by integrating a moving average overlay (OMA). This indicator helps traders identify overbought and oversold market conditions with increased precision. Whether you are a beginner or an experienced trader, using the RSI OMA Indicator in MetaTrader 5 can improve your trading decisions significantly.
What is the RSI OMA Indicator?
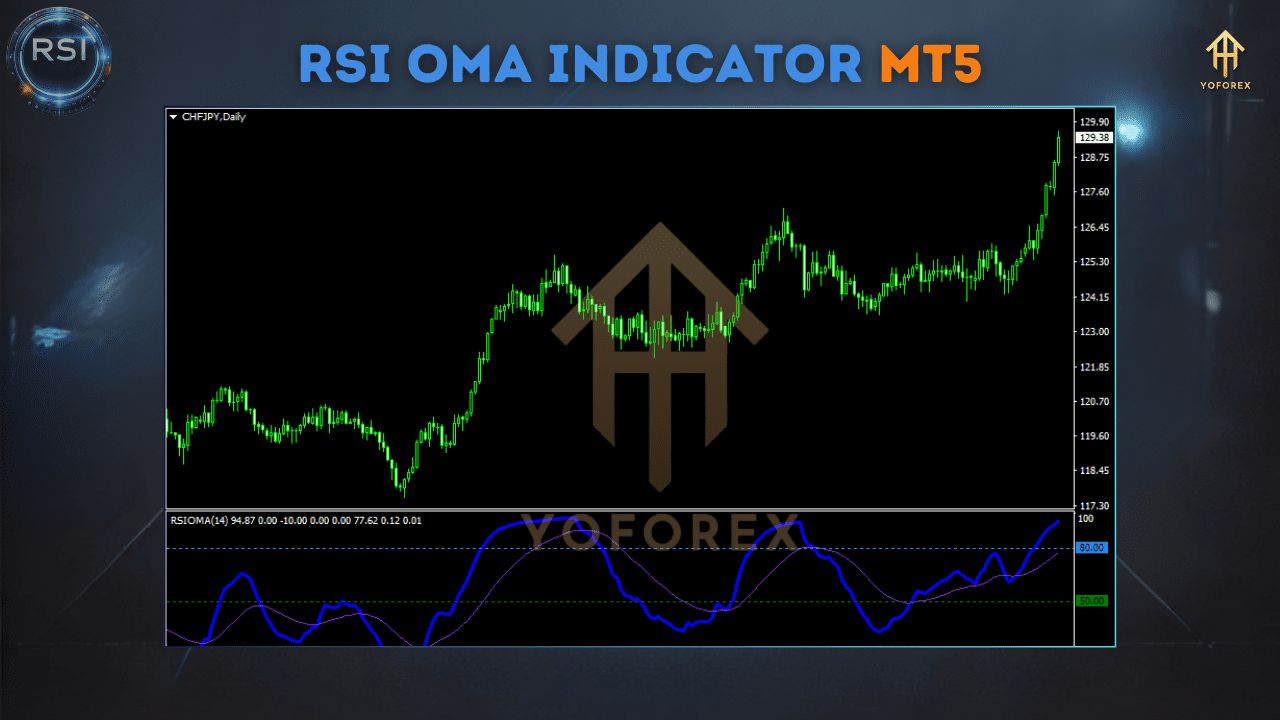
The RSI OMA Indicator is a modified version of the classic RSI. It applies a moving average (OMA) to smooth out RSI values, reducing false signals and providing a clearer trend direction. Unlike the standard RSI, which fluctuates between 0 and 100, the RSI OMA ensures smoother transitions, making it easier to spot trend reversals and entry/exit points.
Key Features of RSI OMA Indicator:
- Customizable Moving Average – Users can set different types of moving averages (SMA, EMA, WMA, etc.).
- Improved Trend Detection – Reduces market noise and provides better trend visualization.
- Overbought & Oversold Alerts – Helps traders avoid unnecessary trades during extreme market conditions.
- Easy to Use – Suitable for both novice and professional traders.
- Compatible with All Timeframes – Works efficiently across various market conditions.
How Does the RSI OMA Indicator Work?
- Trend Identification – The indicator smooths RSI fluctuations, helping traders recognize bullish and bearish trends more clearly.
- Overbought & Oversold Conditions – When the RSI OMA crosses above 70, the asset is considered overbought; when it drops below 30, it is oversold.
- Signal Confirmation – The moving average filter ensures more reliable signals, reducing the likelihood of false breakouts.
- Divergence Detection – Traders can spot potential reversals when the RSI OMA diverges from price movements.

How to Use the RSI OMA Indicator in MT5
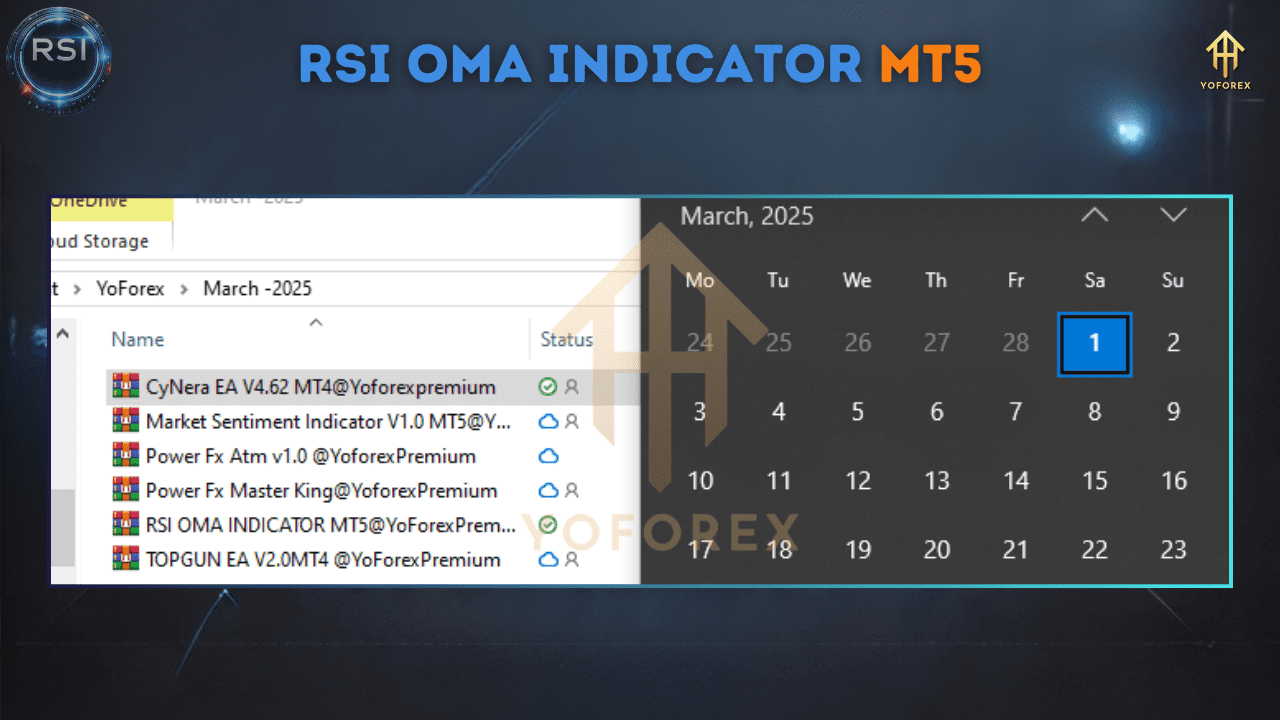
- Download the RSI OMA Indicator MT5 file from a reliable source.
- Open MetaTrader 5, click on File > Open Data Folder.
- Navigate to MQL5 > Indicators and paste the indicator file.
- Restart MT5 to enable the indicator.
- Open the MT5 platform and select your preferred trading chart.
- Click Insert > Indicators > Custom > RSI OMA.
- Adjust the settings (period, moving average type, color preferences) as needed.
- Click OK to apply the indicator.
- Look for crossovers to determine potential buy/sell signals.
- Combine RSI OMA with other technical tools like Moving Averages or Bollinger Bands for better confirmation.
- Avoid trading in highly volatile markets without additional confirmation.
Best Trading Strategies Using RSI OMA Indicator MT5
- Buy when RSI OMA crosses above 50 and confirms an uptrend.
- Sell when RSI OMA crosses below 50, signaling a downtrend.
- Identify price-action divergence with RSI OMA.
- Enter trades when RSI OMA shows a divergence signal against price trends.
- Enter long trades when RSI OMA falls below 30 and starts turning upward.
- Enter short trades when RSI OMA rises above 70 and begins to decline.
Advantages of RSI OMA Indicator MT5
- Reduces Market Noise – The moving average overlay smooths out irregular RSI movements.
- Minimizes False Signals – Enhanced filtering provides more accurate trend signals.
- Works Well in Different Market Conditions – Suitable for forex, stocks, and commodities.
- Customizable Settings – Traders can adjust parameters for personalized trading strategies.
Stay Update
https://www.fxcracked.org/product/rsi-oma-indicator/
https://www.forexfactory.cc/product/rsi-oma-indicator/
https://yoforexea.com/product/rsi-oma-indicator/
Join Our Telegram – https://t.me/+yfGB1dbSxjAyNmI9


There are no reviews yet.